One honest view of a treasury spread across a dozen wallets.
- Industry
- Web3
- Product
- Web App
- Platform
- Web
- Year
- 2025
01The Real Problem
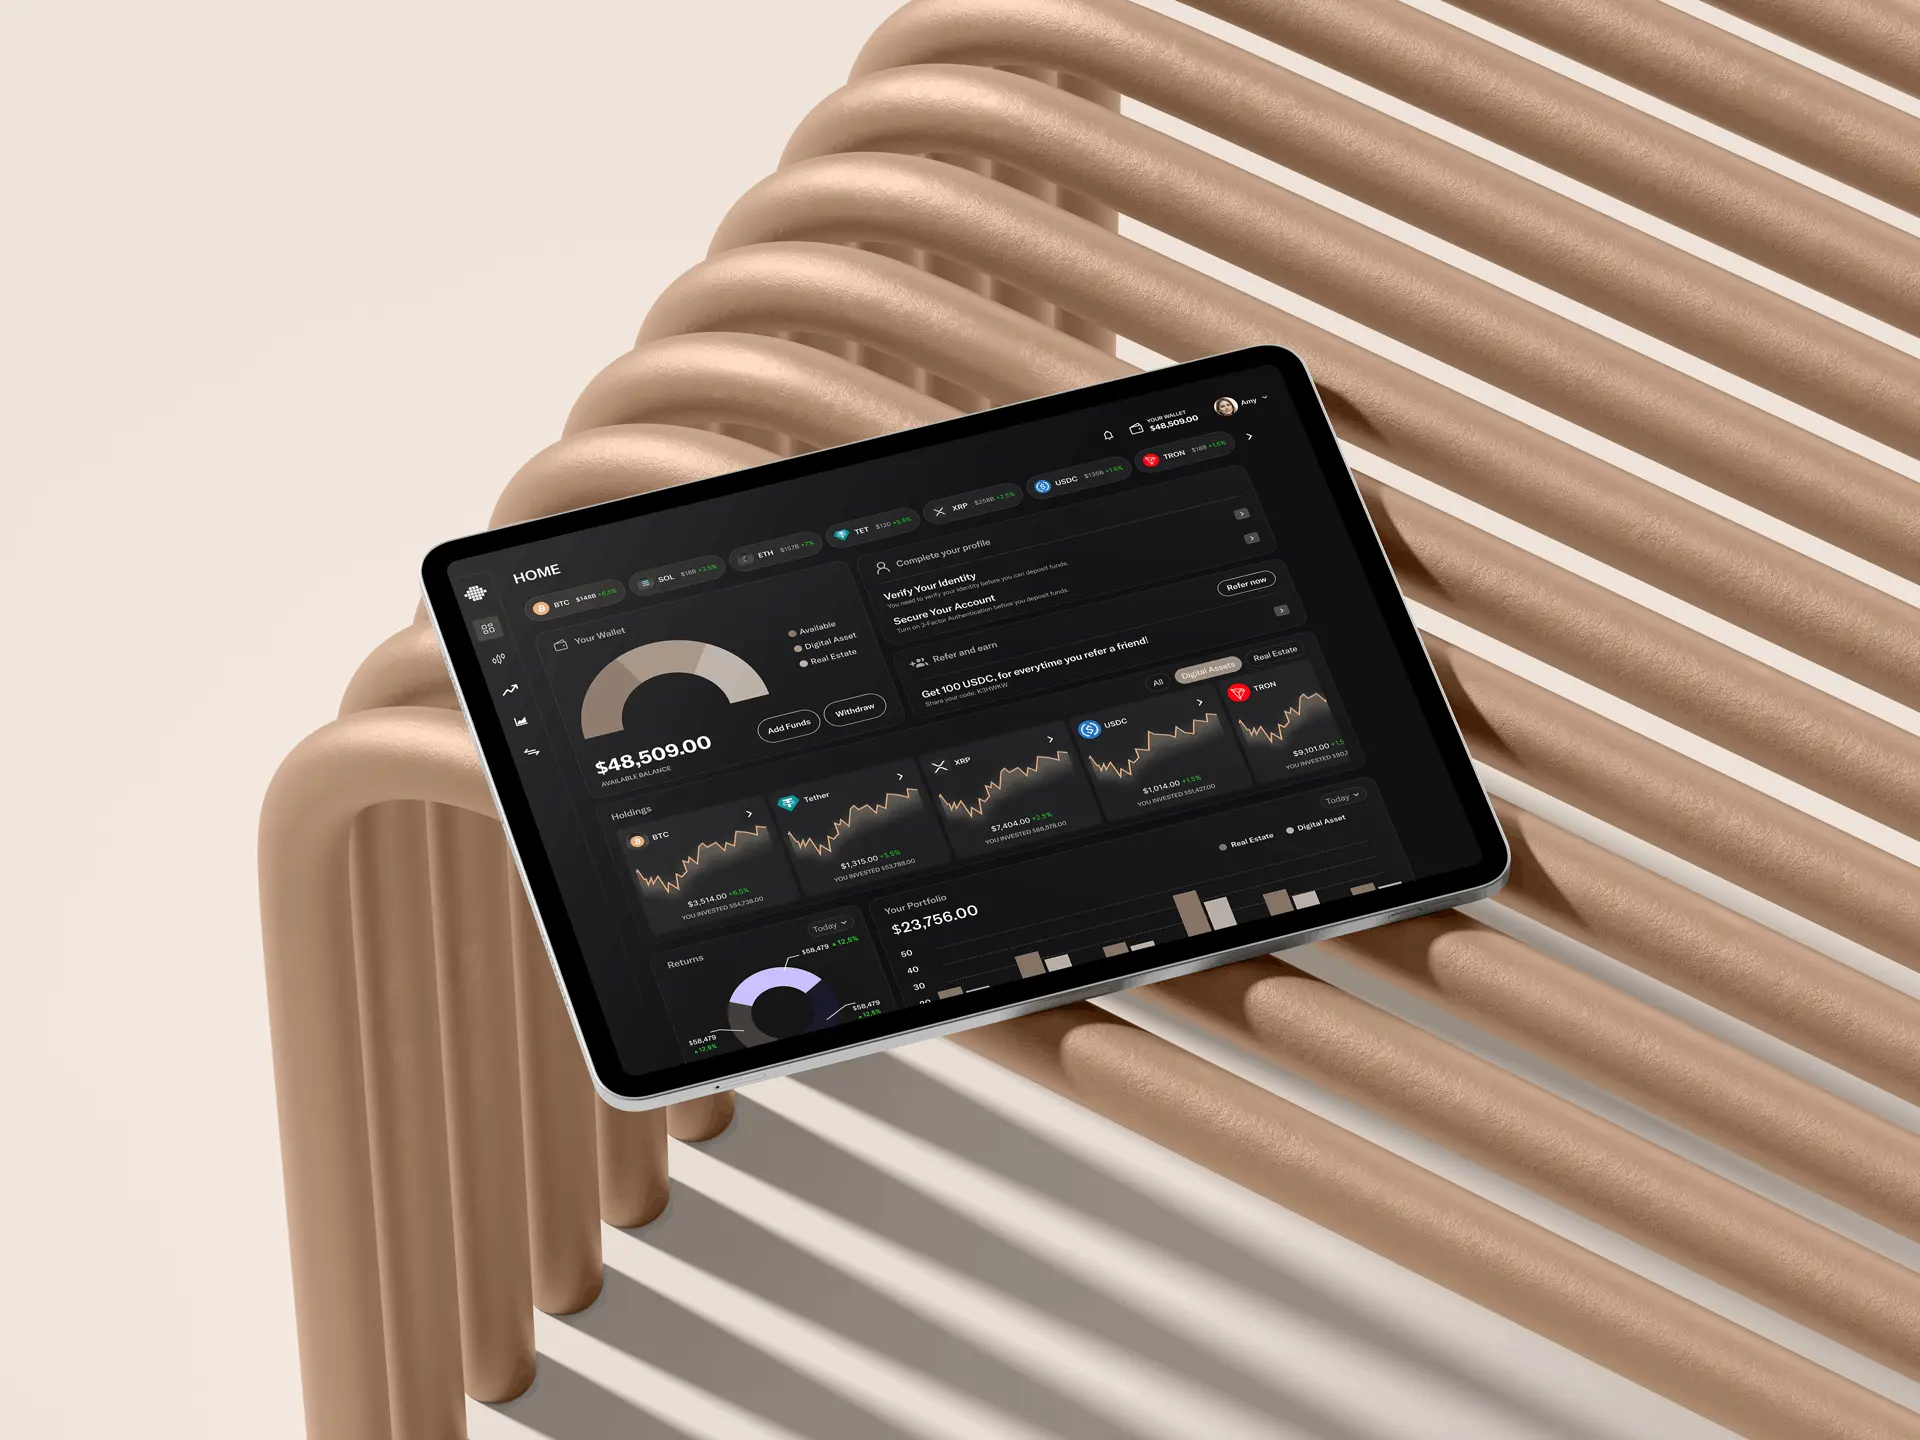
Mosaic is a treasury platform for organisations holding crypto. Its job is to answer one question that is surprisingly hard to answer: what do we actually hold, and what is it exposed to?
The difficulty is structural. Assets sit across many wallets, chains and platforms, each with its own interface and its own idea of what a balance means. Anyone responsible for the treasury ends up assembling a picture by hand, in a spreadsheet, on a market that does not wait for them to finish.
The audience raises the bar further. These are people making decisions with real consequences, so the interface has to look like something a finance team can rely on rather than a crypto dashboard built for excitement.
So the questions were:
- 01How do you aggregate wildly different sources into one picture without flattening away what matters?
- 02How do you show risk and exposure to someone scanning, not studying?
- 03How does a real-time product stay calm when the market is not?
02Finding the Fix
I designed it as a reporting tool that happens to be live, rather than a trading interface that happens to report.
- 01Institutional, not exciting. Restrained colour, dense but ordered layouts, and no animation on numbers, because movement on a figure implies urgency that is rarely there.
- 02Composition before performance. What you hold and how concentrated it is comes first; how it performed comes second. Concentration is the risk people actually miss.
- 03Colour means one thing only. It is reserved for status and risk, never for decoration, so a red on this platform is always information.
The design work then concentrated on three things:
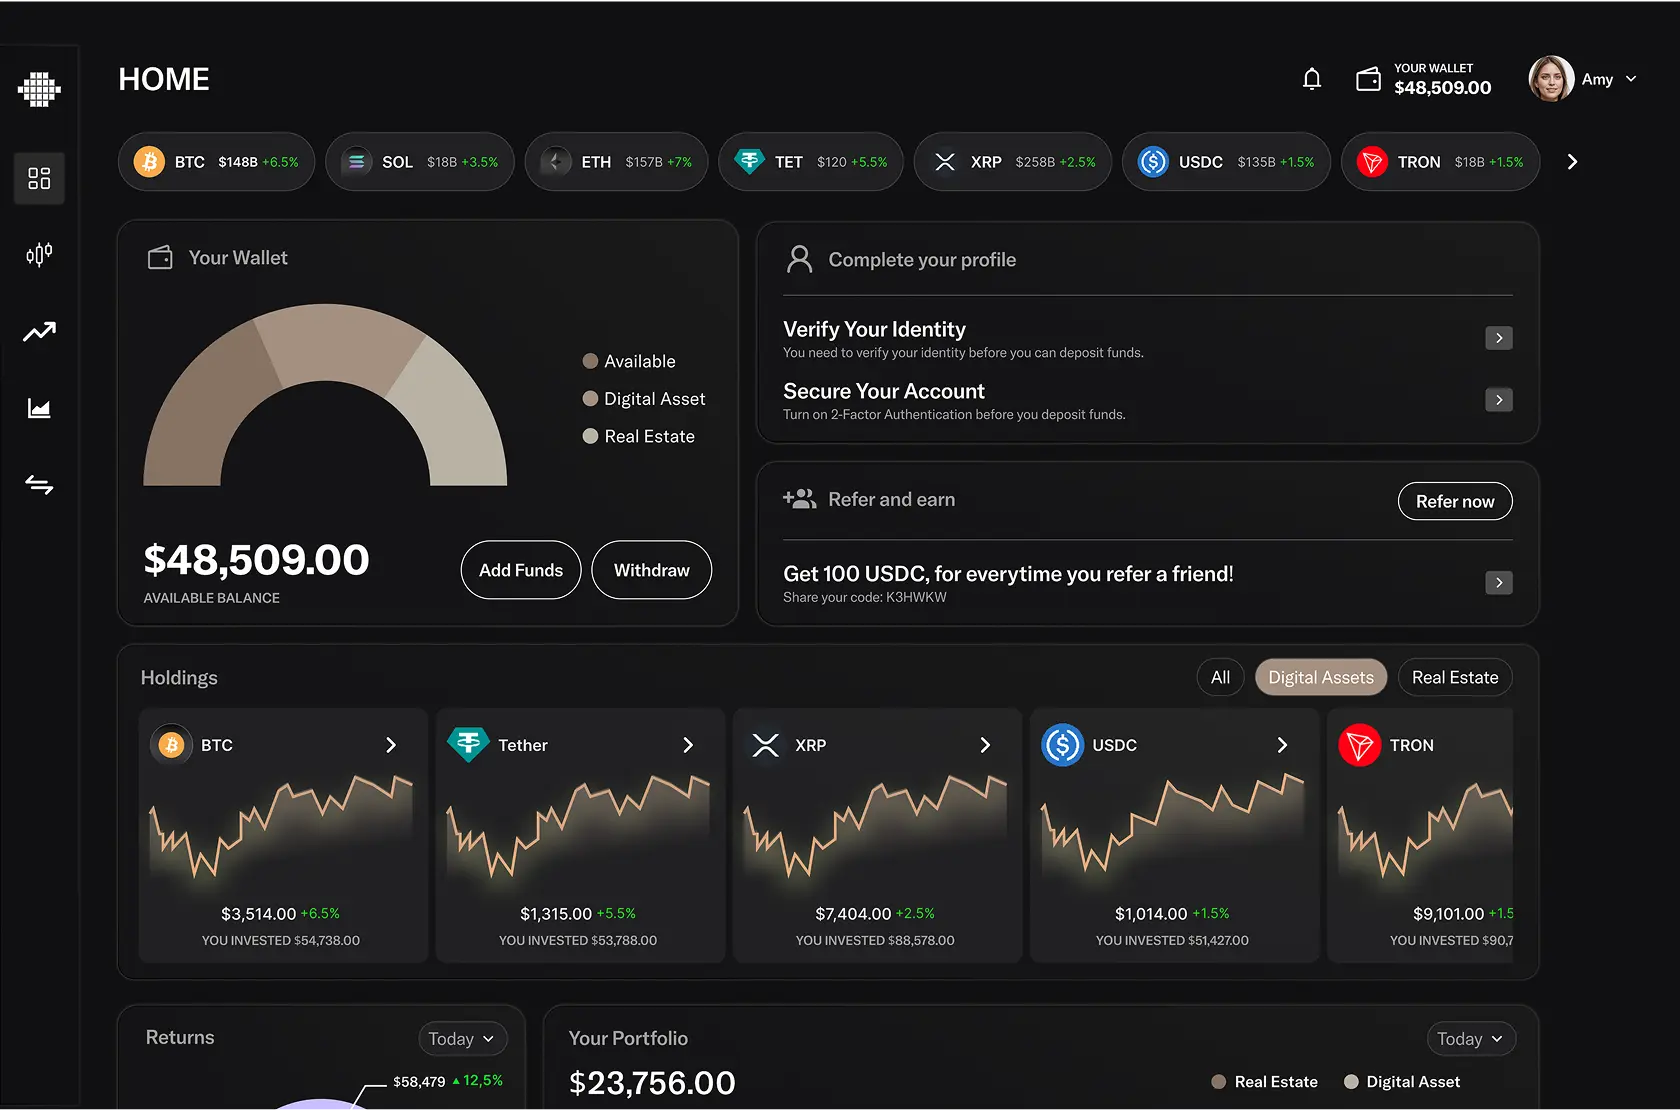
- 01A dashboard that answers holdings, exposure and liquidity above the fold, since that is the reason anyone opens it.
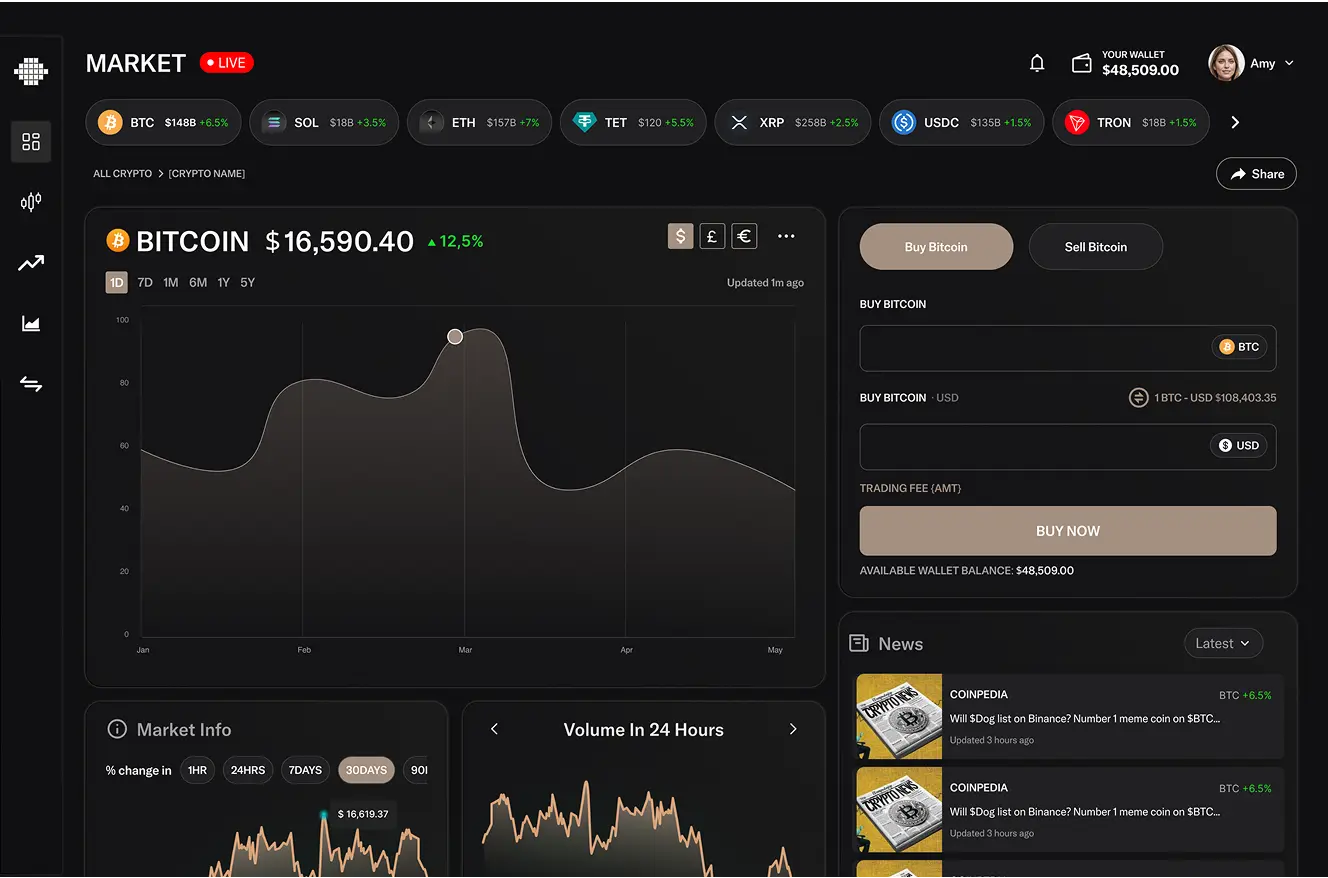
- 02A chart system with consistent scales and behaviour across every view, so comparisons are never accidentally misleading.
- 03Explicit data freshness on every figure, because in a real-time product a stale number that looks live is worse than no number.
03What Actually Happened
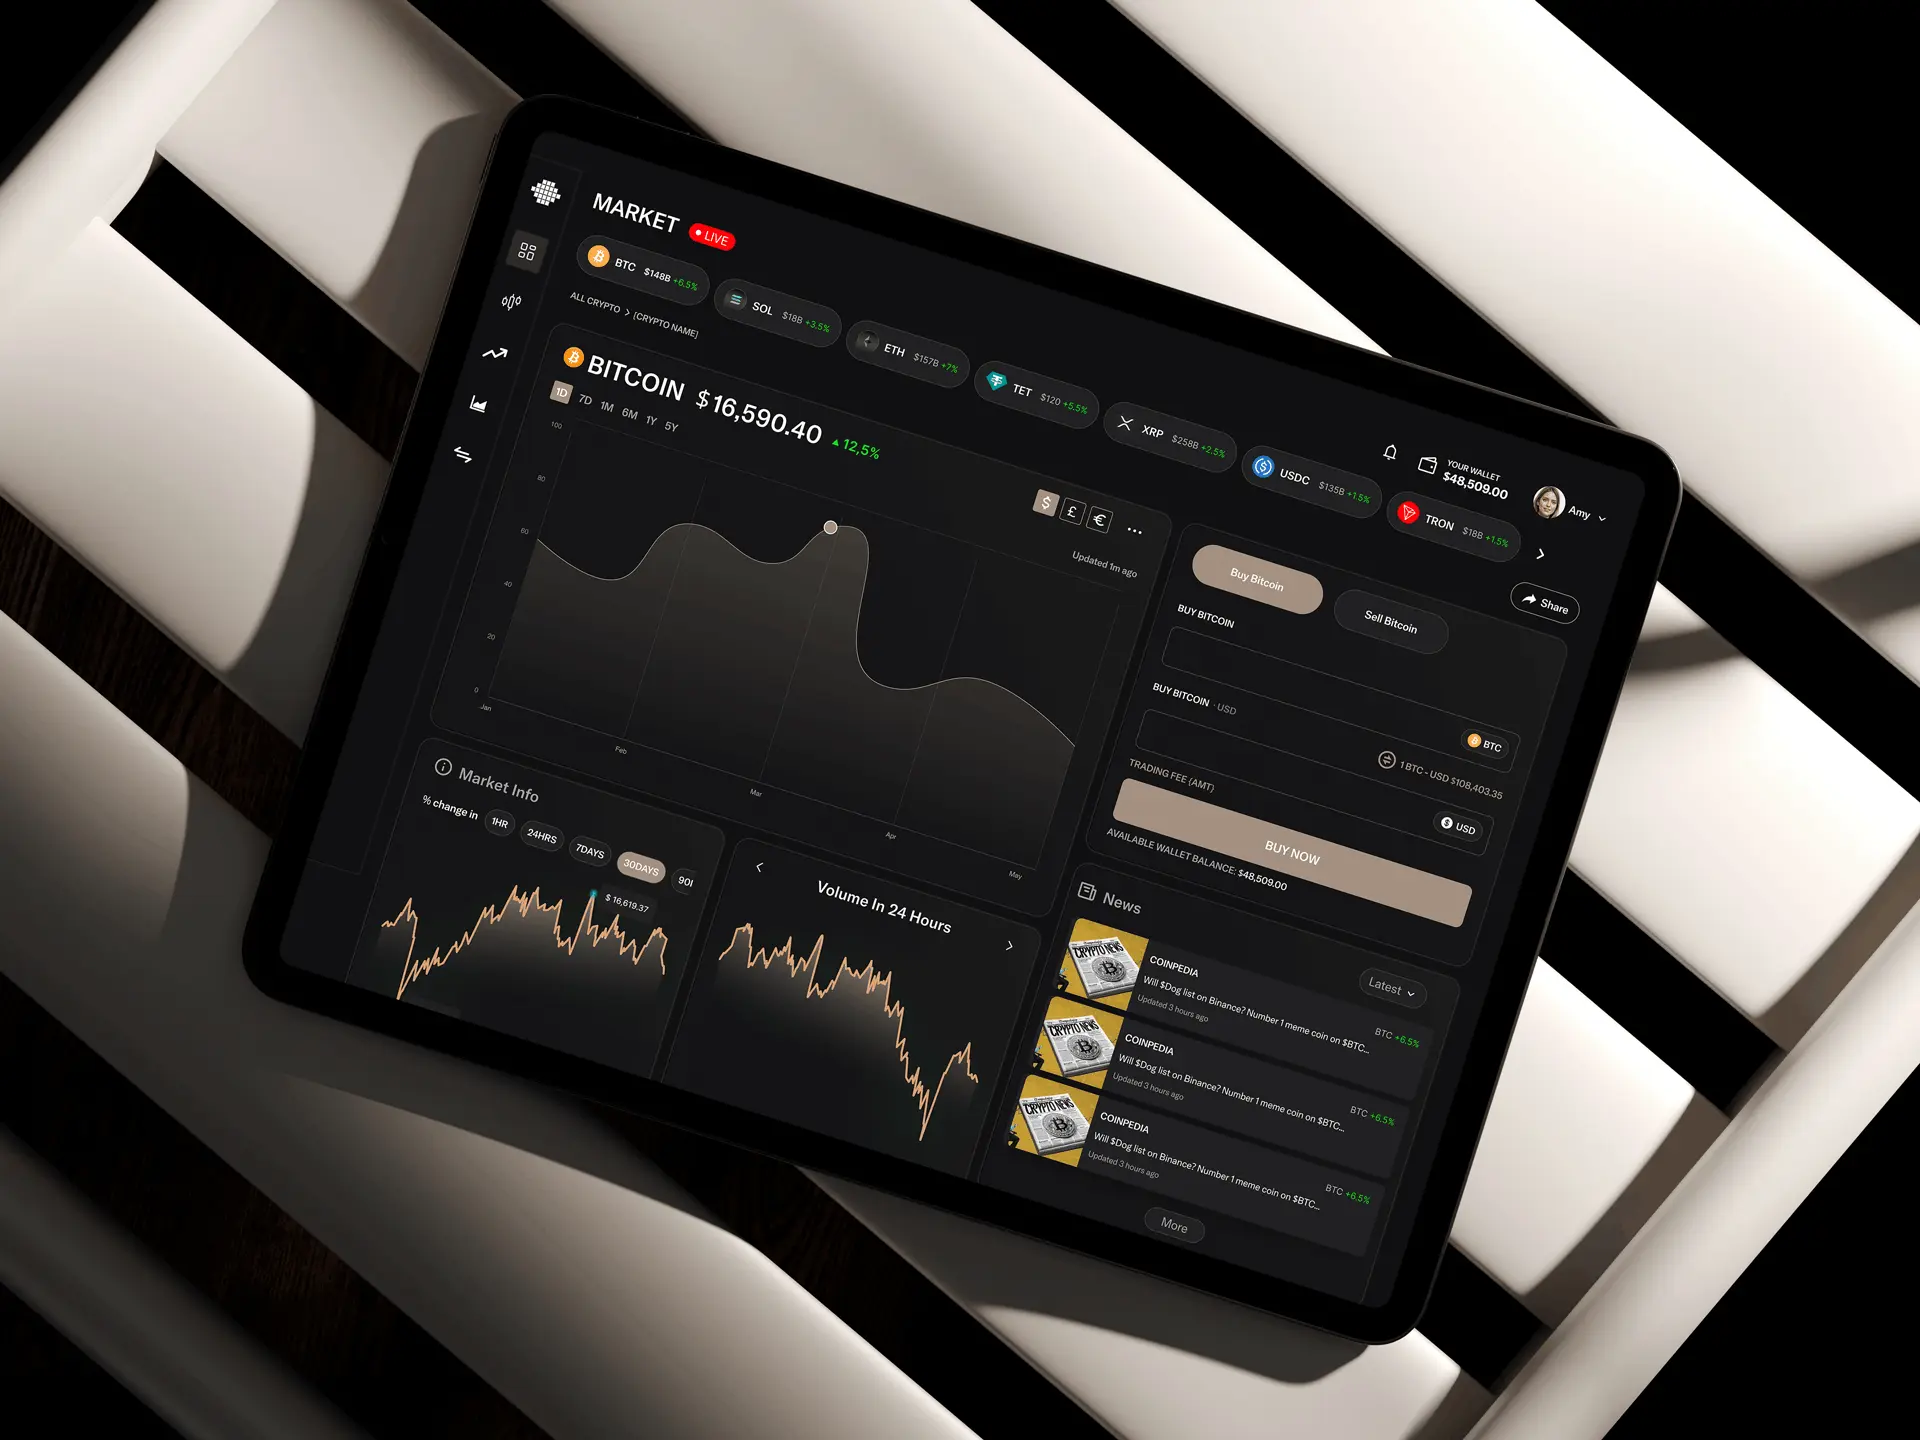
The first dashboard I designed was too eager. It animated value changes, coloured everything, and updated constantly, all of which reads as a trading screen. For a treasury team that is not just wrong in tone, it is actively unhelpful: it makes ordinary volatility feel like an event. Removing the motion and restricting colour made the same data far easier to think about.
The aggregation view also changed. My first pass showed every wallet as an equal row, faithful to the underlying structure and useless in practice, because a treasury does not think in wallets. Grouping by asset and by type, with the wallet detail one level down, matched how the decisions are actually made.
The rest was iteration on charts and density with the team, tuning how much fits on a screen before scanning turns into reading.
04What Changed
Mosaic launched on web and mobile.
What the design had to deliver
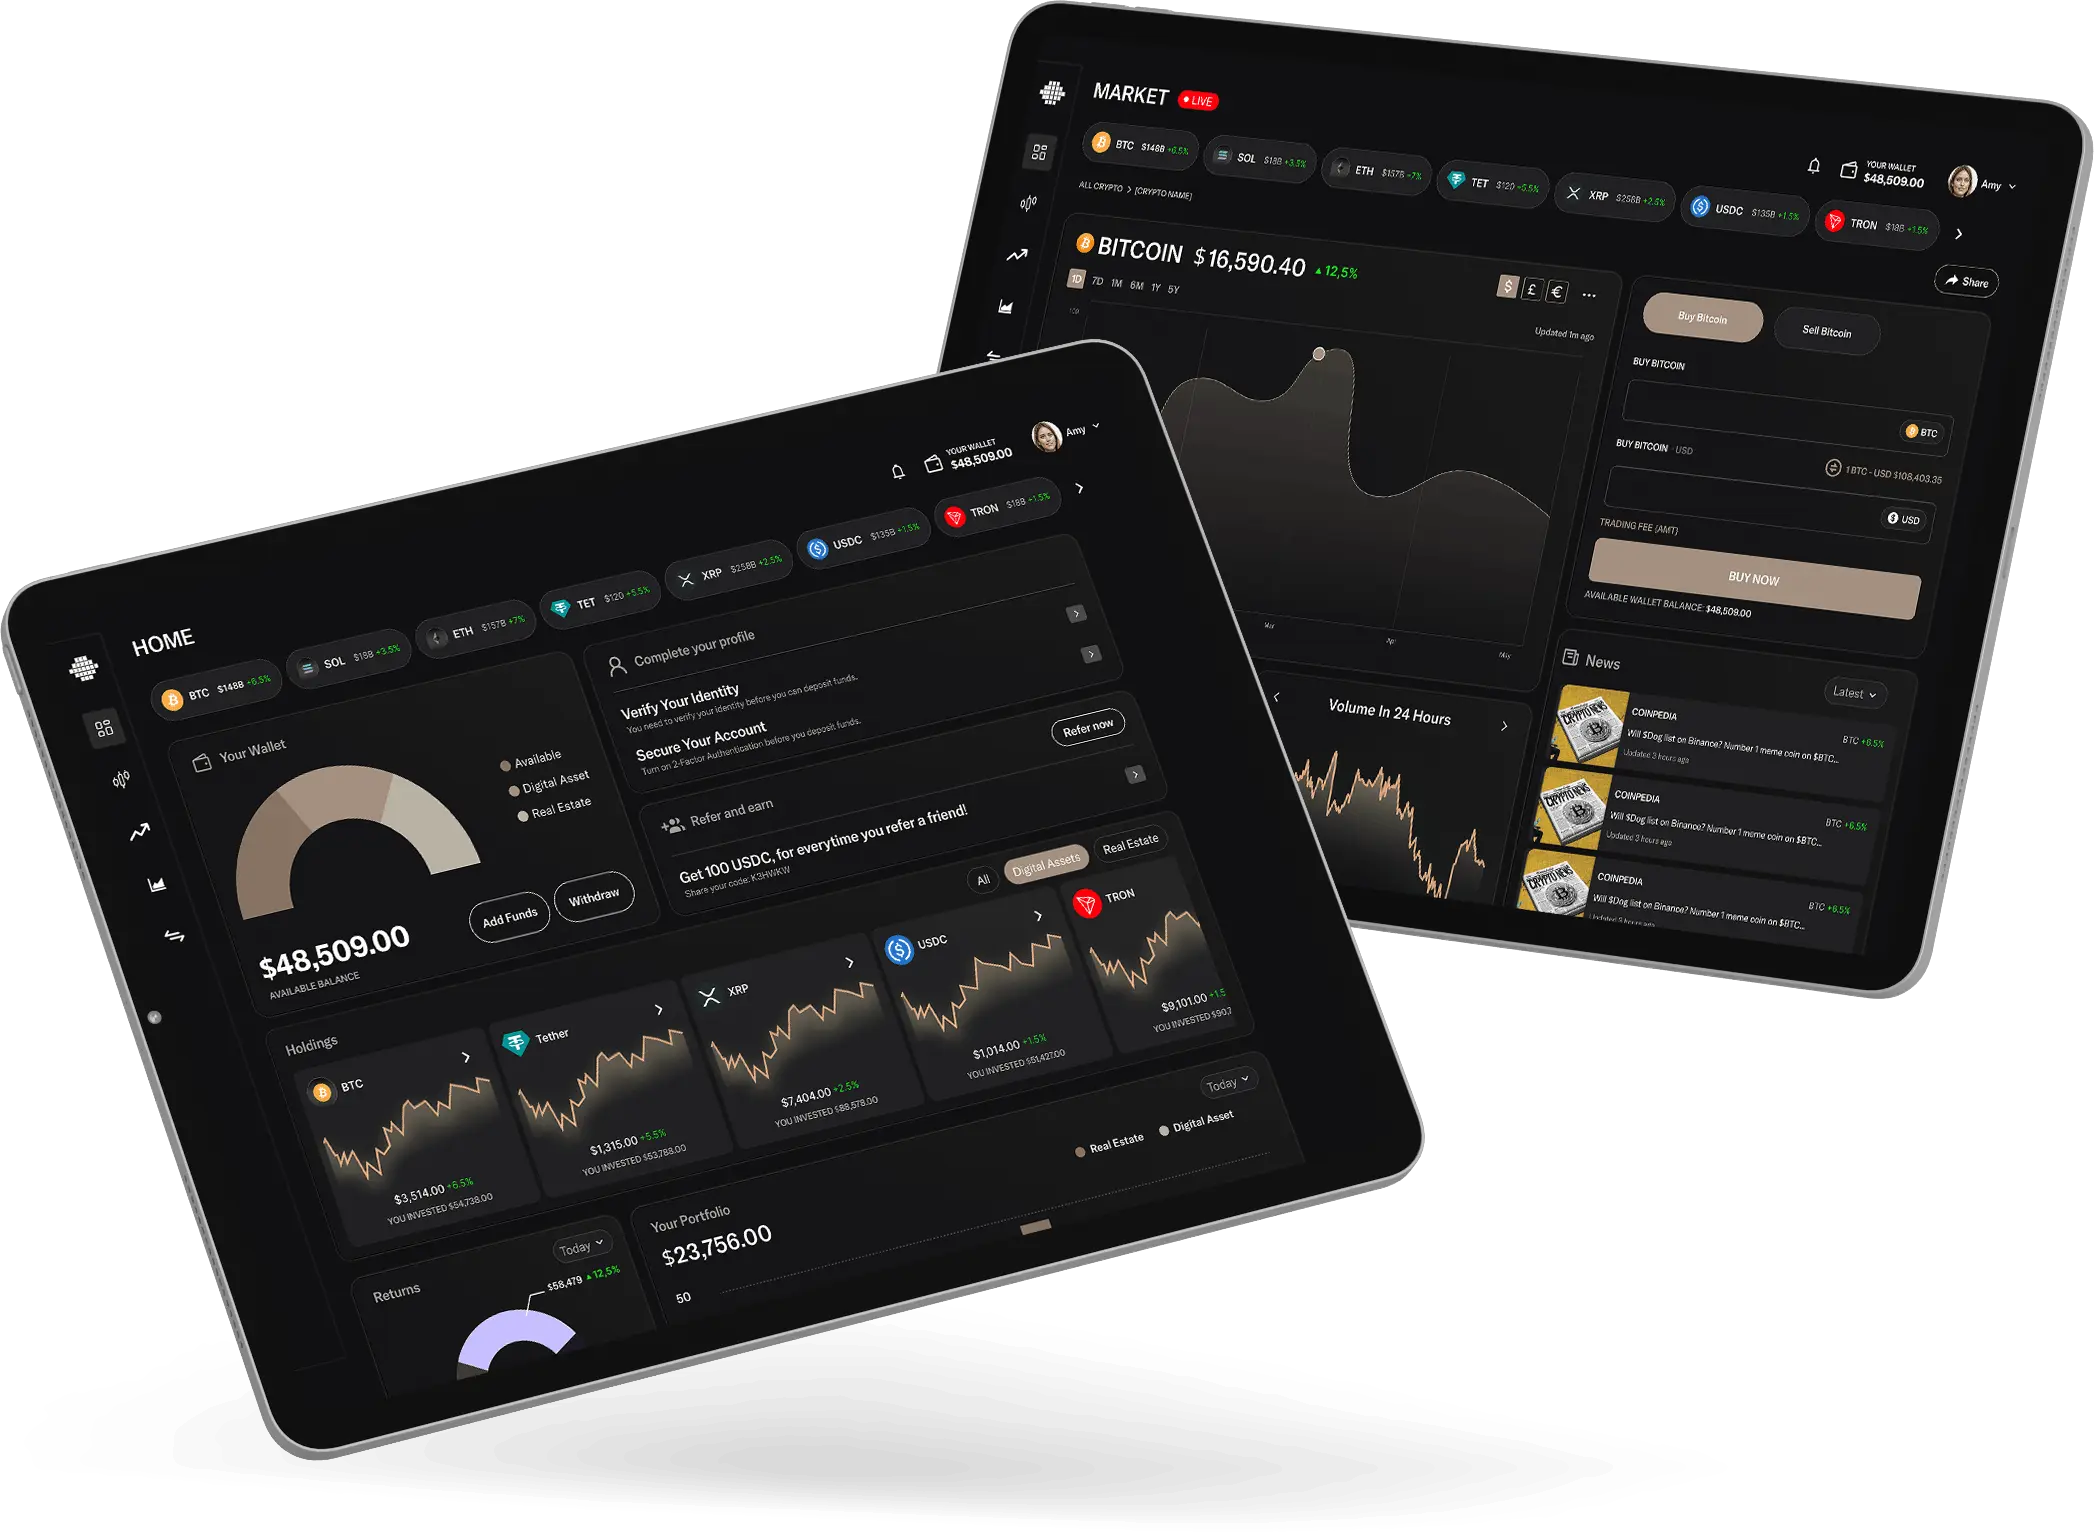
- 01Holdings, exposure and liquidity answered in one screen.
- 02A tone a finance team would trust.
- 03Numbers that always say how fresh they are.
The restraint is the piece I am most pleased with, which is an odd thing to say about a dashboard, but calm was the hardest thing to achieve and the most valuable.
05What I Had to Work With
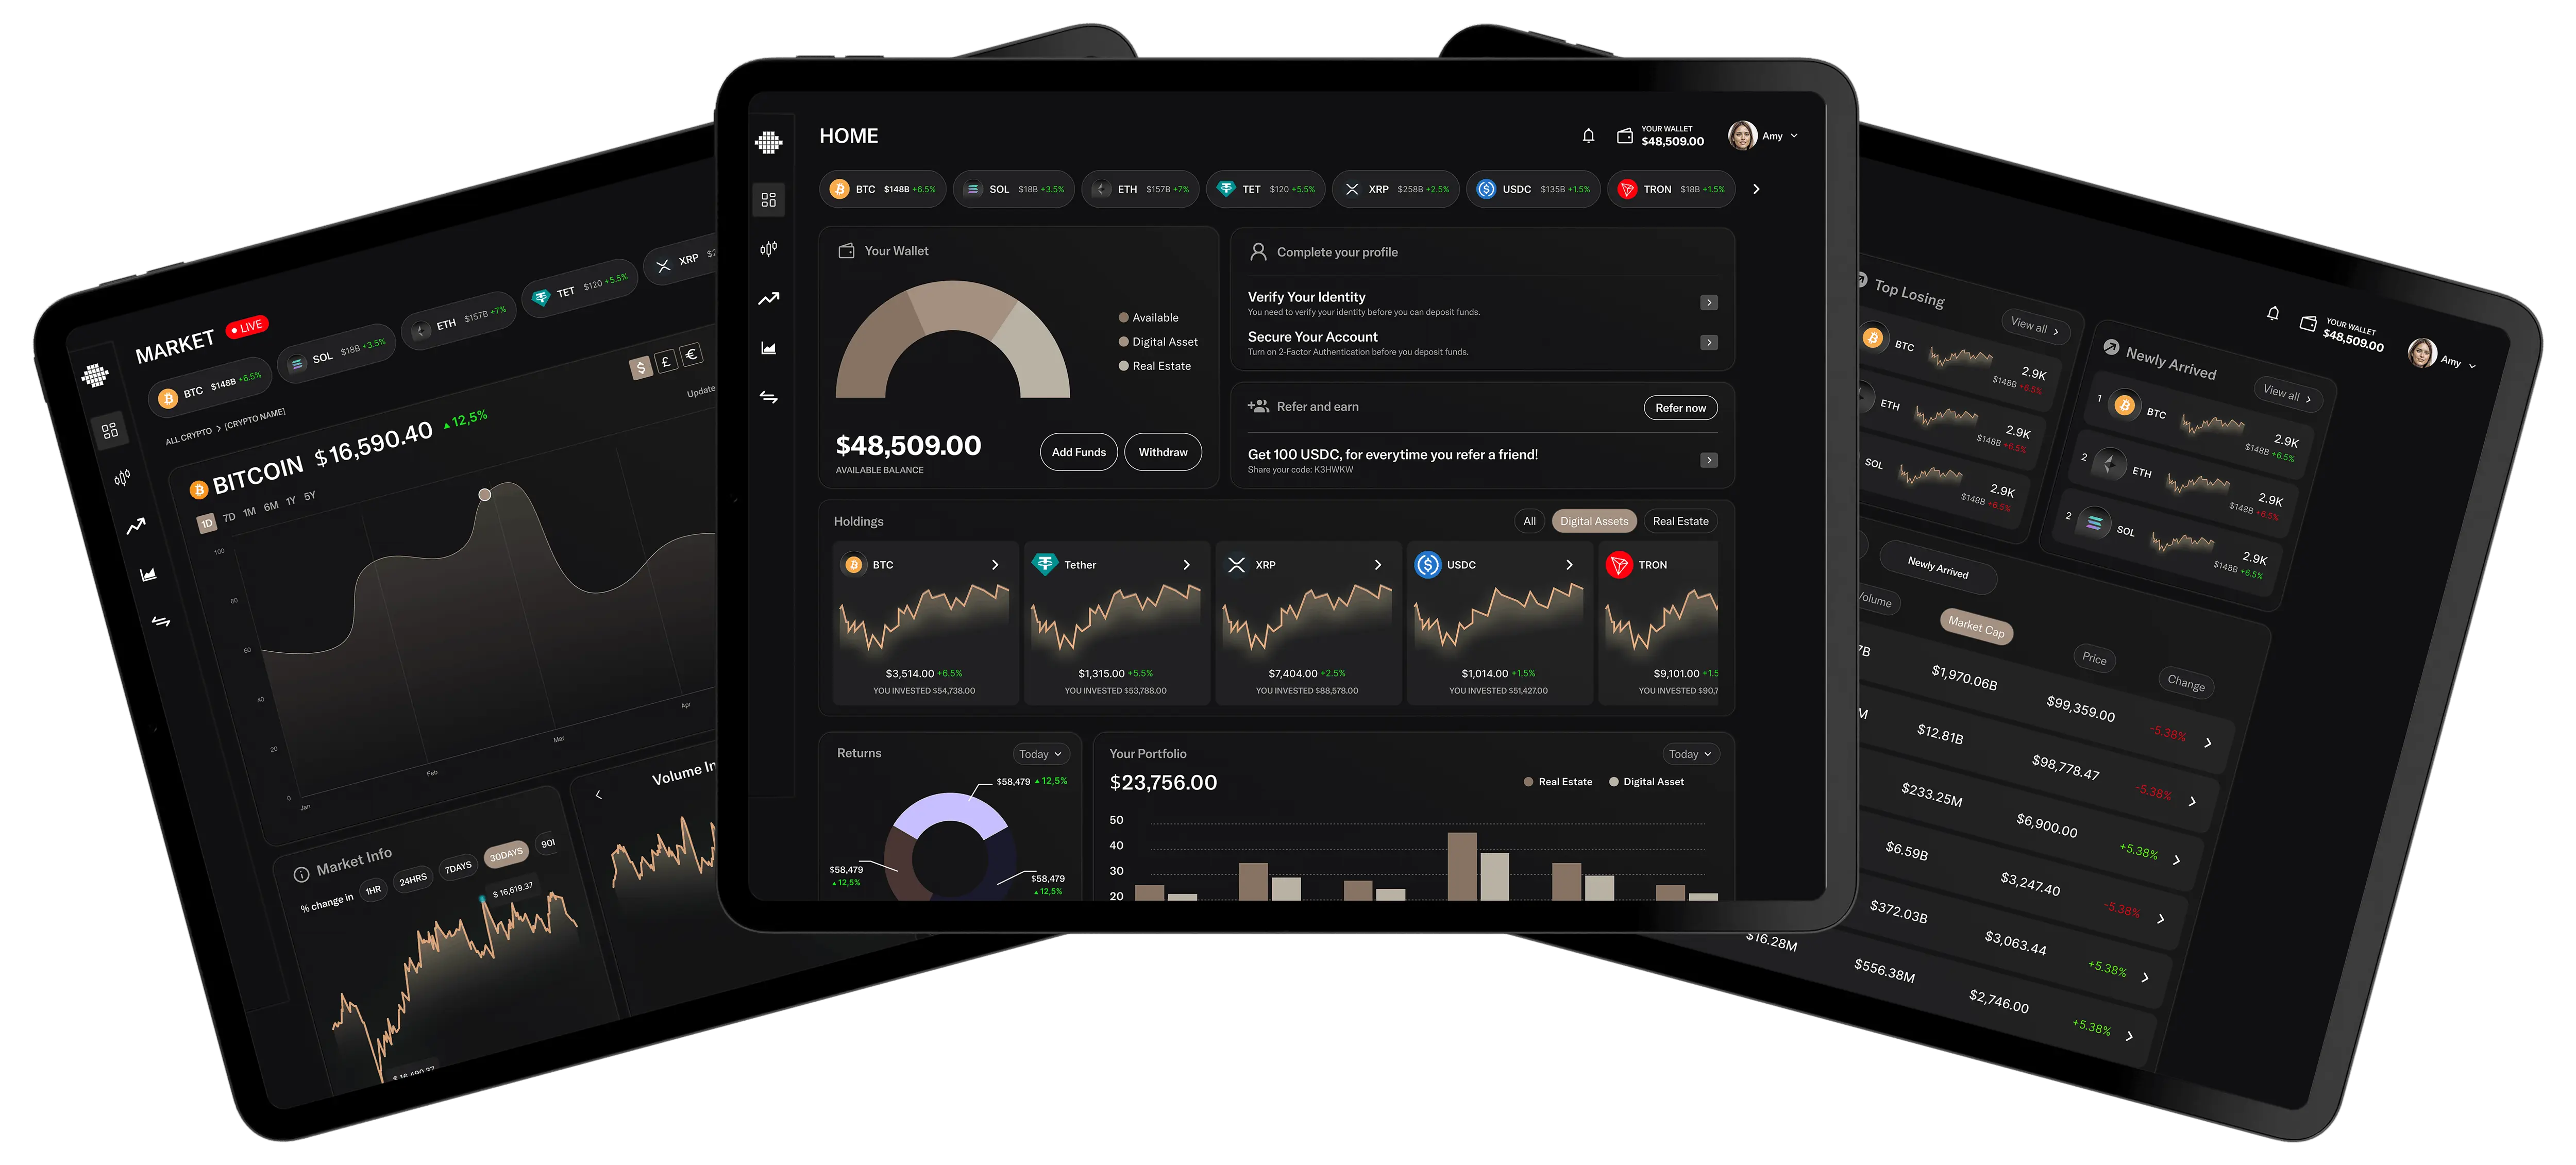
Those constraints pushed the whole product toward consistency: one chart system, one colour language, one way of showing uncertainty.
- 01Data from many sources. Different chains and platforms report differently, so the interface had to cope with incomplete and inconsistent inputs without looking broken.
- 02Real time is a burden. Constant updates make a screen hard to read and hard to trust, so the design had to decide what genuinely needed to move.
- 03Density with clarity. This audience wants a lot of information at once, which is the hardest kind of screen to keep legible.
06What I'd Do Differently
I would design with messy real data from the start. Everything looks well-proportioned with tidy sample numbers, and nothing about a real treasury is tidy.
I would also define the risk model before the visuals. I designed risk indicators before the team had fully settled what risk meant here, and that cost a redesign once the definition firmed up.
What I Learned
- 01Motion is a claim. Animating a number tells the reader it is urgent. On a treasury screen that claim is usually false.
- 02Mirror the decision, not the database. Wallet-by-wallet was accurate and unusable; asset-by-asset matched how people actually decide.
- 03Freshness is part of the number. In a live product, a figure without a timestamp is only half the information.