Turning scattered token data into something you can actually read.
- Industry
- Web3
- Product
- Web App
- Platform
- Web
- Year
- 2025
01The Real Problem
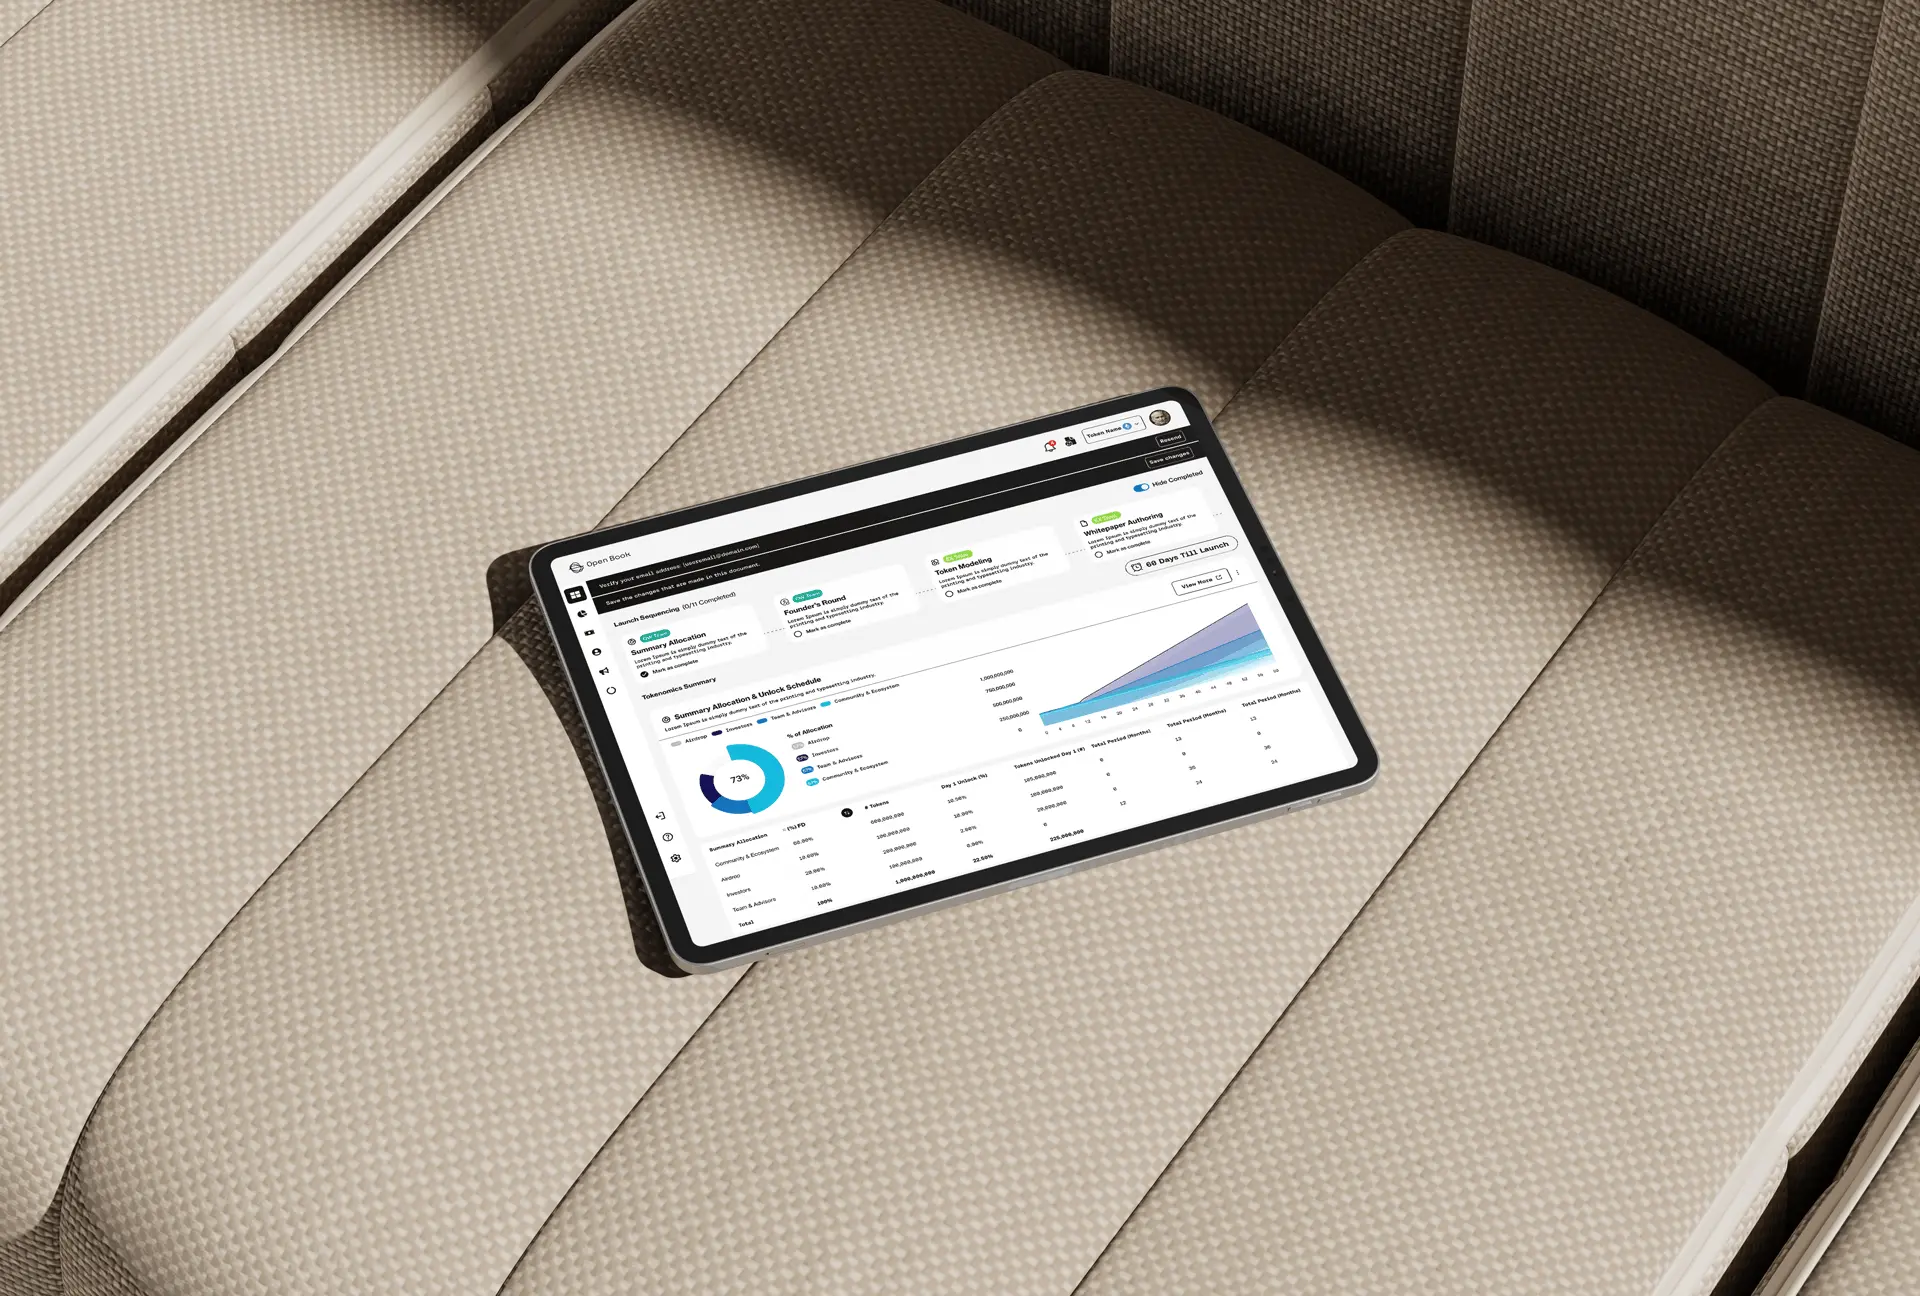
Open Book tracks token launches, tokenomics and market maker activity in one place. The name is the argument: this information exists, it is just scattered across enough tools that nobody sees the whole picture.
Anyone researching a token today runs four or five tabs and reconciles them by hand. That is slow, and worse, it is unreliable: the numbers disagree, and there is rarely anything telling you which source is current. In a market where distribution and unlock schedules decide outcomes, a fragmented picture is not an inconvenience, it is the risk.
So the design questions were:
- 01How do you make an allocation and unlock schedule readable at a glance?
- 02How do you present data you cannot fully guarantee without either overclaiming or hedging everything into uselessness?
- 03How does a platform this dense stay usable on a phone?
02Finding the Fix
The thing that made the product coherent was treating time as the primary axis. Tokenomics is fundamentally a question about the future: who can sell what, and when.
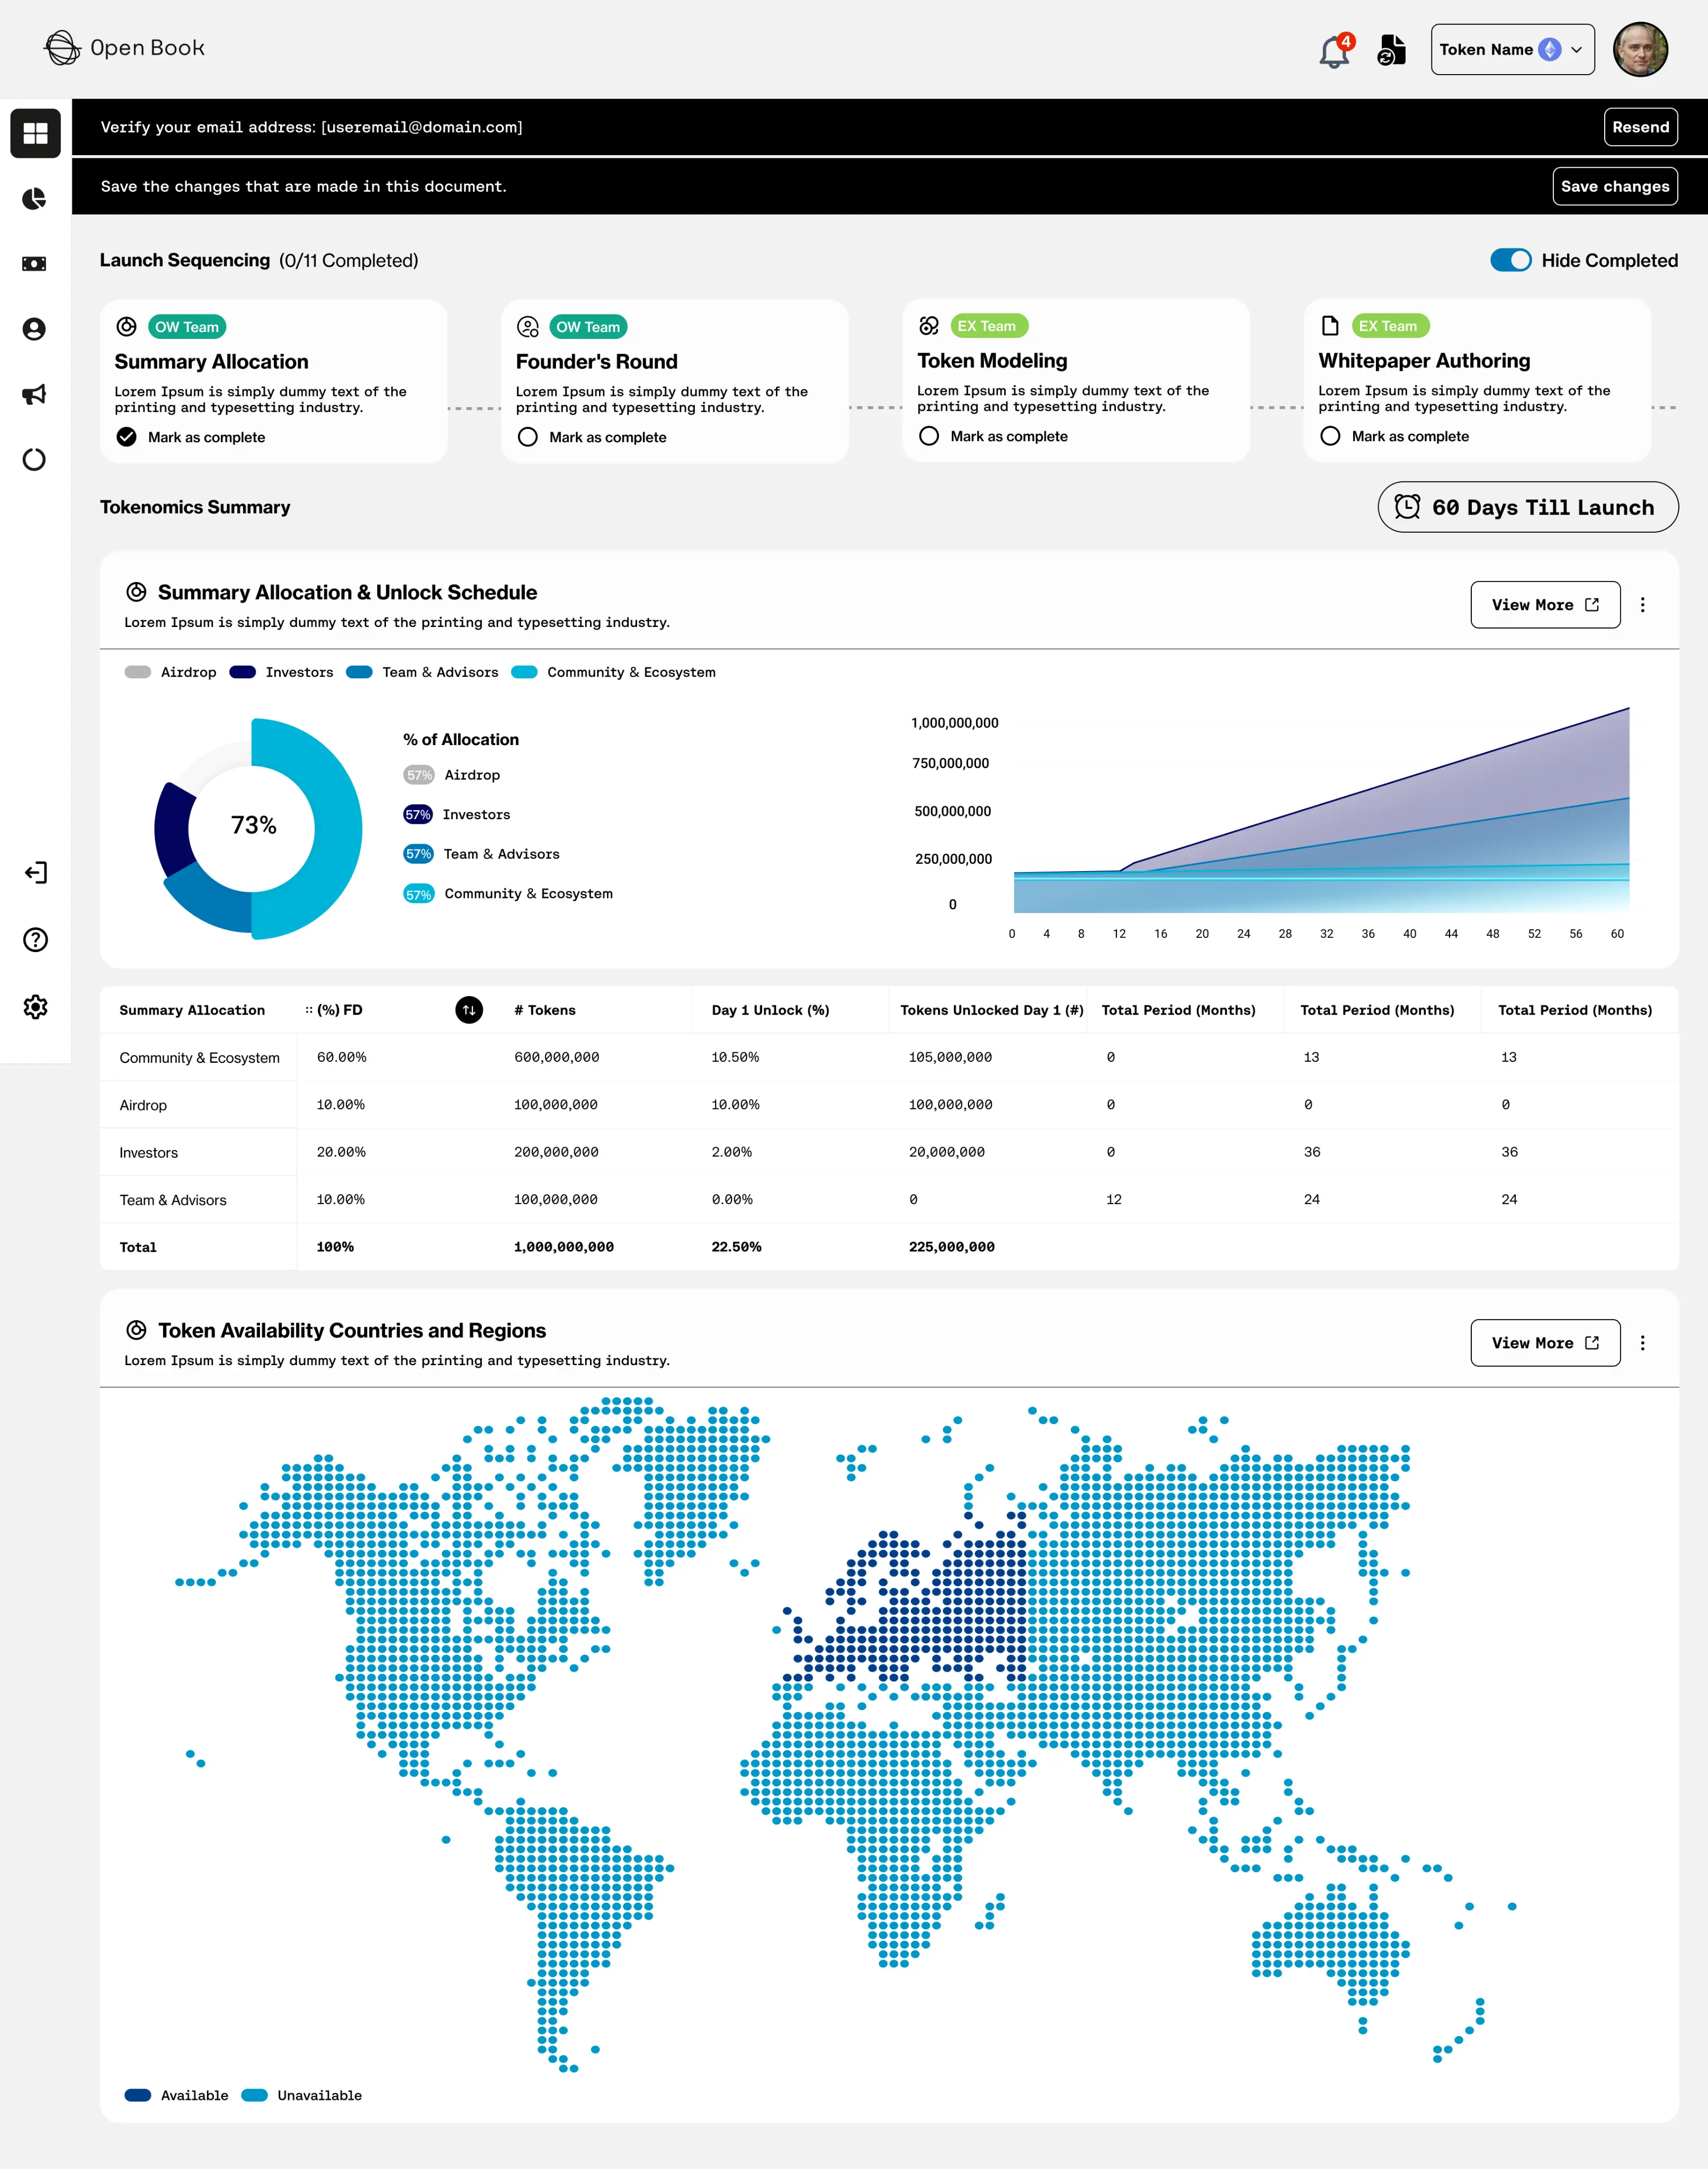
- 01Unlock schedules are the headline. A timeline of what unlocks when says more than any allocation pie chart, so it leads every token view.
- 02Say where it came from. Source and freshness sit next to the figures, so the platform is honest about certainty instead of implying it.
- 03One chart language. Allocation, distribution and market maker views share scales and behaviour, so a reader learns to read the platform once.
The design work then concentrated on three things:
- 01A token page ordered by the questions people ask, in order: what is it, who holds it, what unlocks next, what is happening now.
- 02Alerts as a first-class feature, since most of what matters here happens while you are not looking.
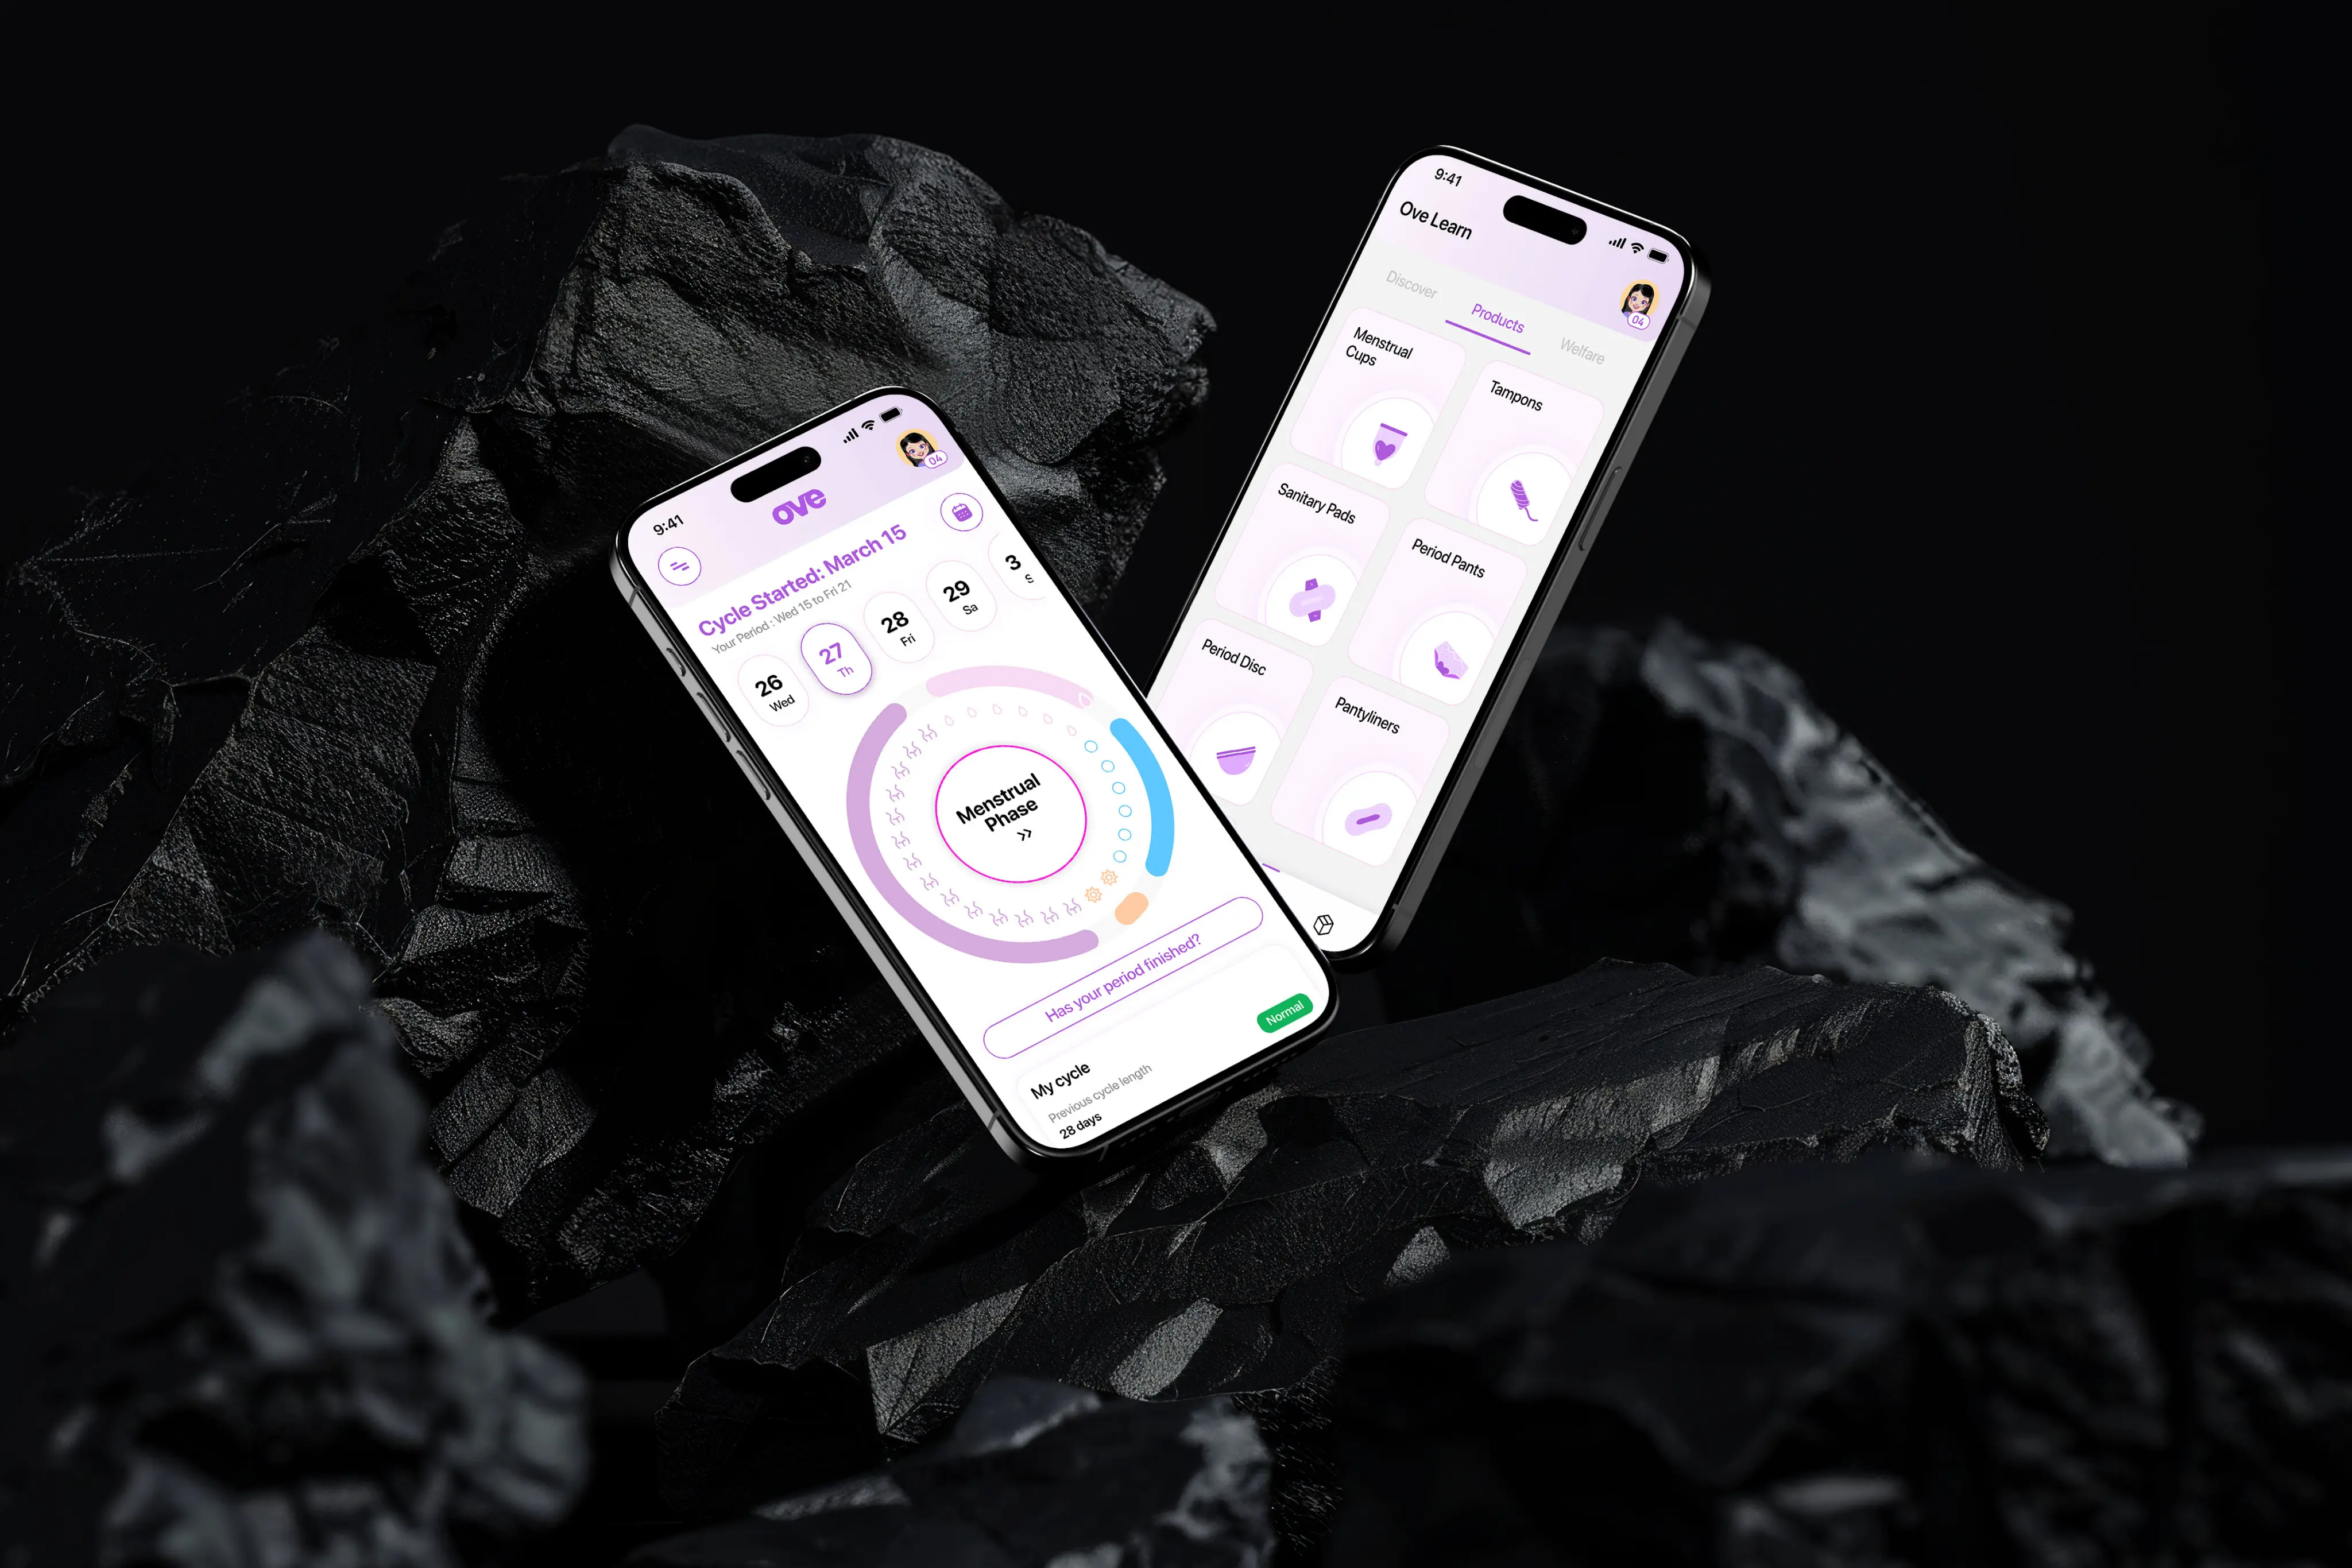
- 03A mobile view that answers the same questions with fewer charts, rather than shrinking the desktop layout.
03What Actually Happened
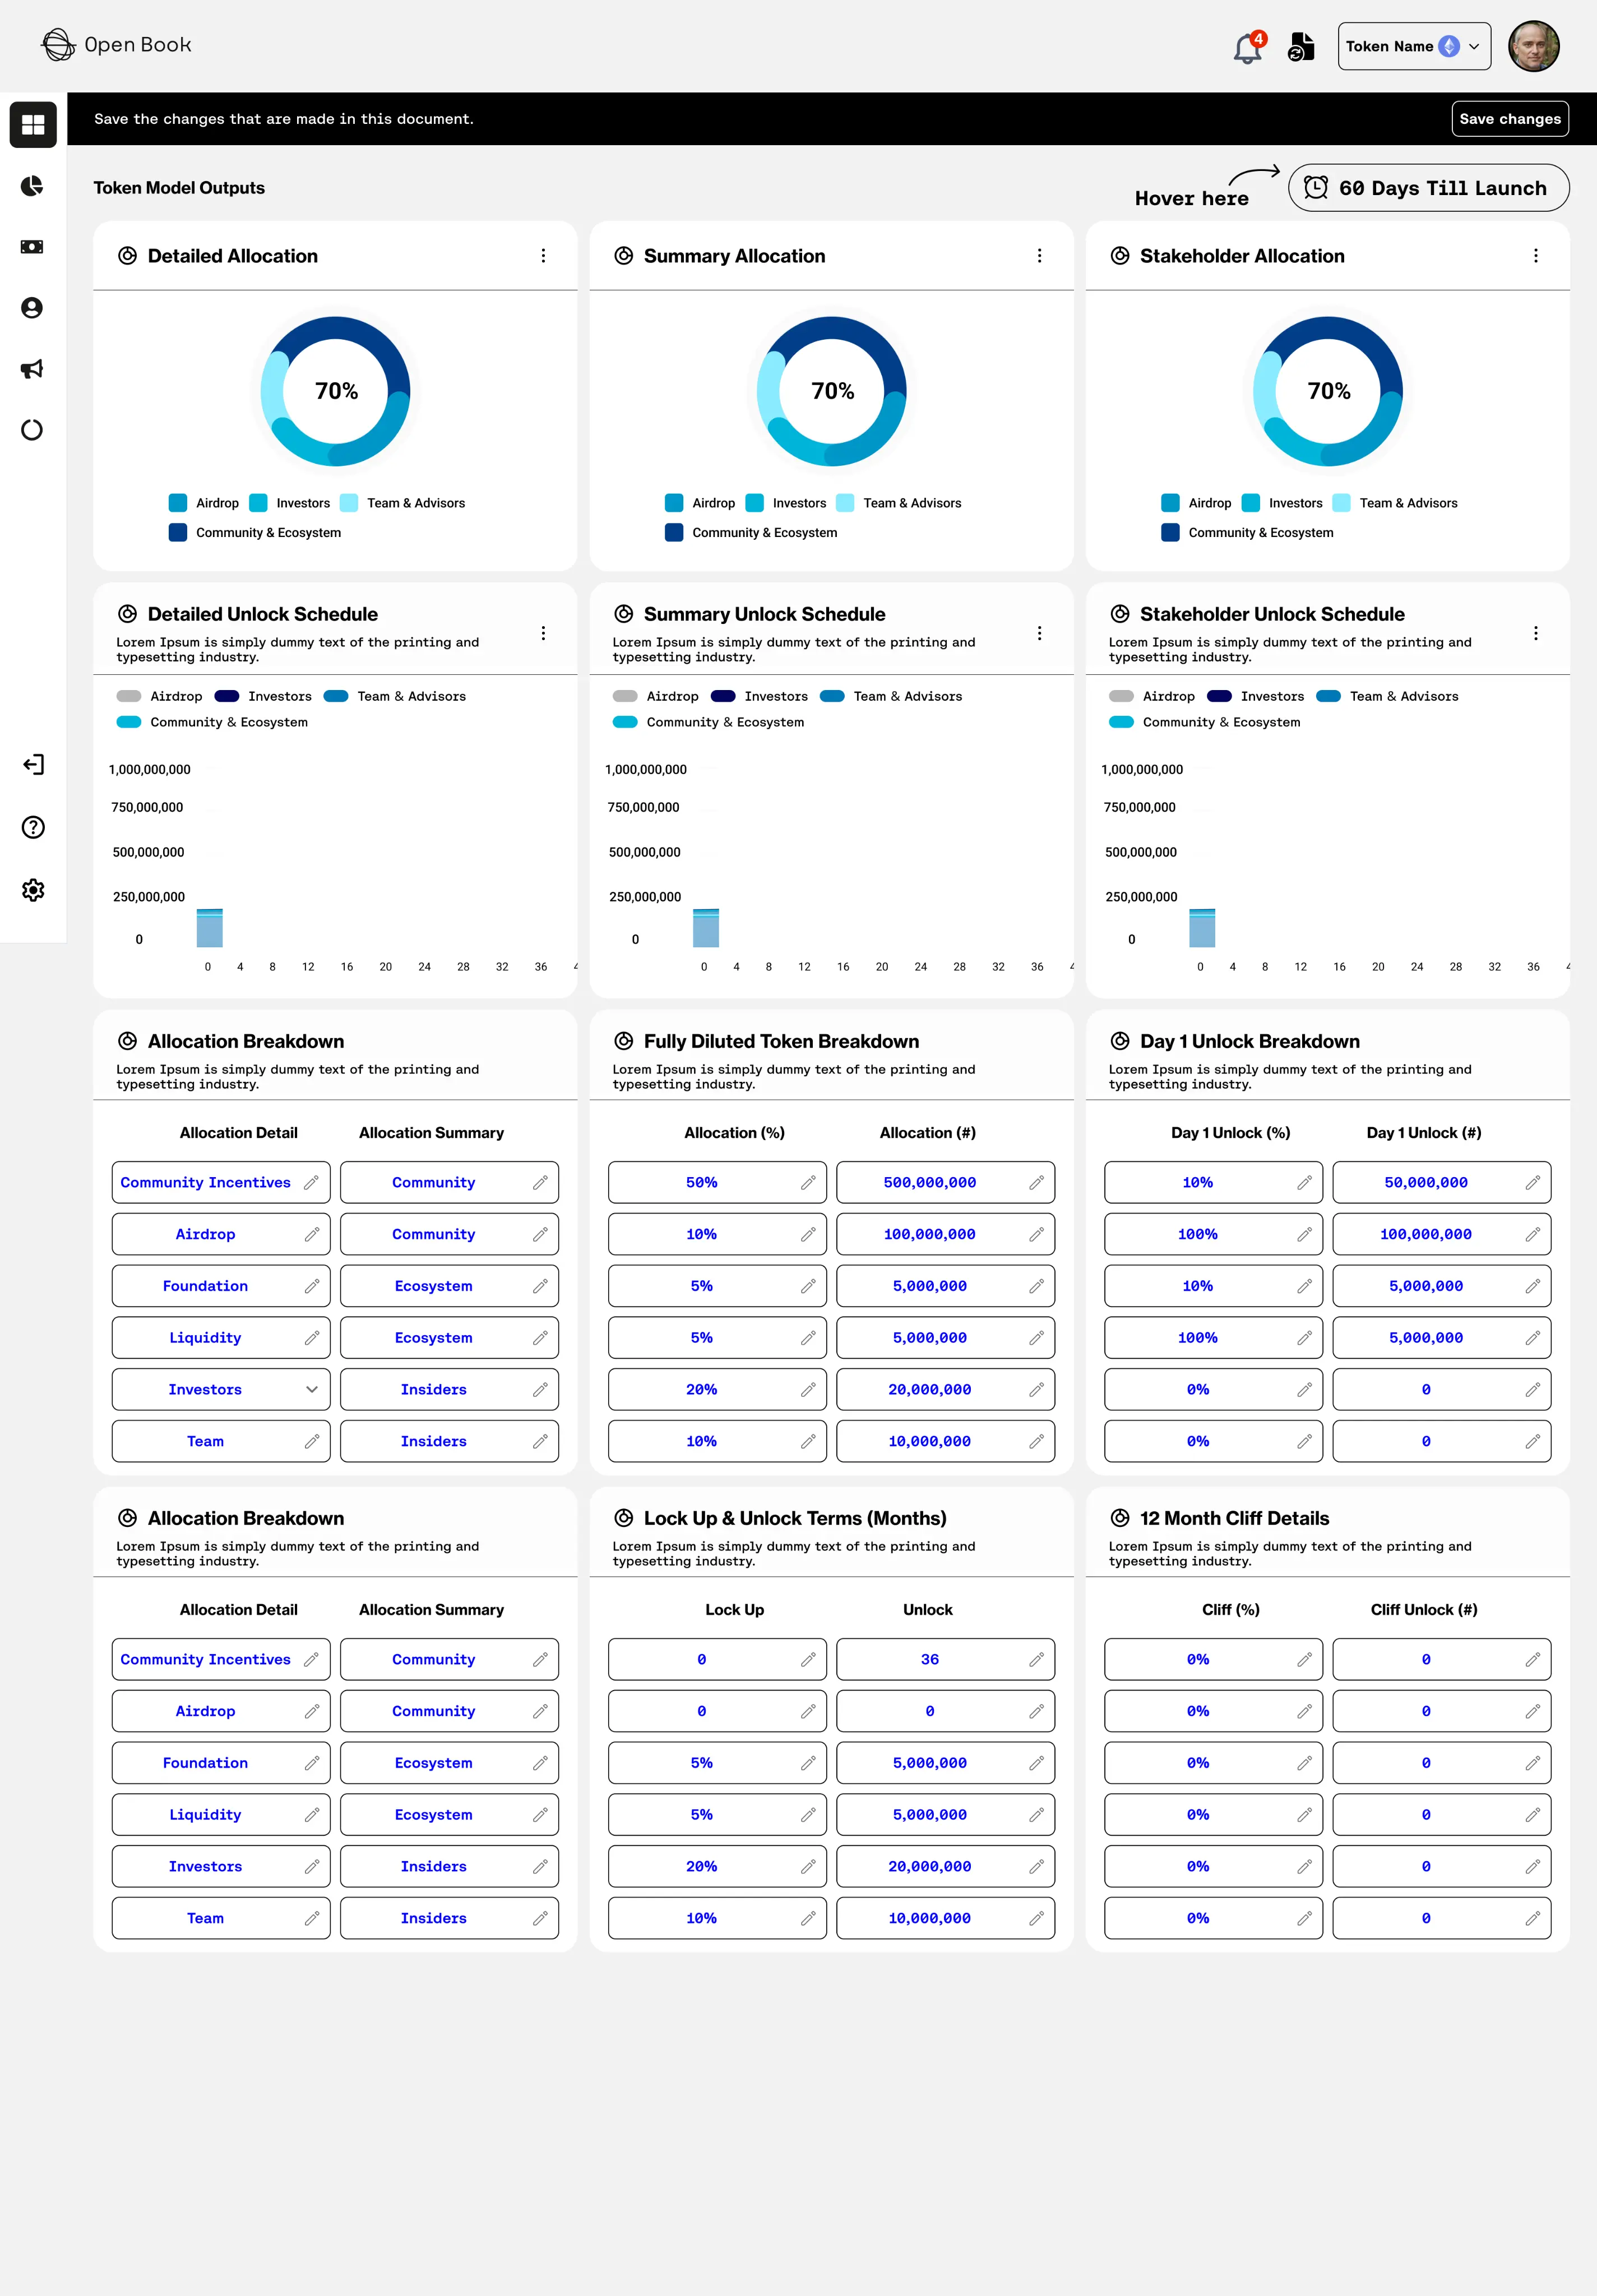
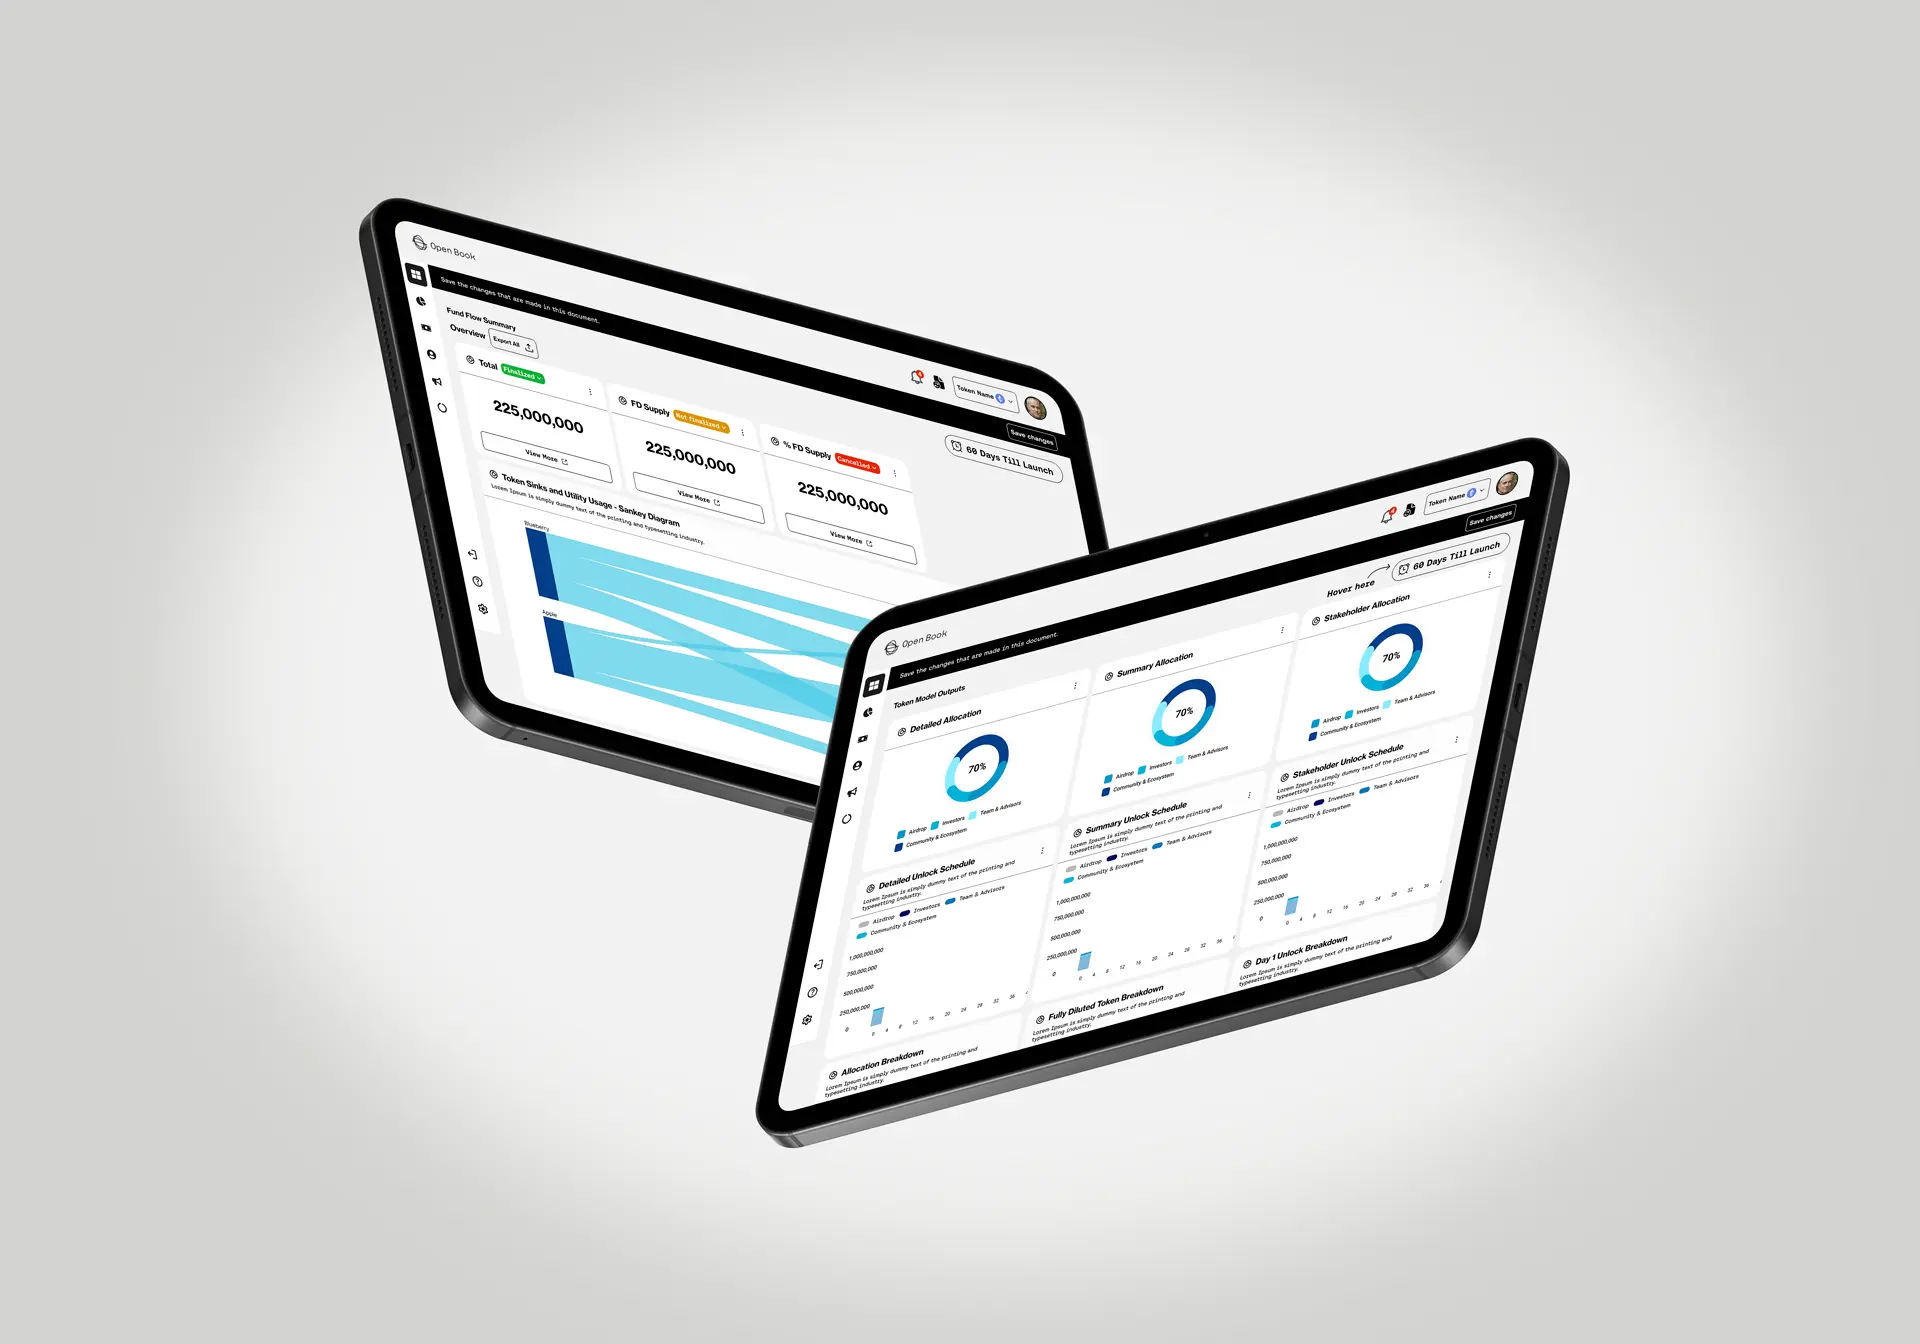
My first token page was a wall of charts. Everything the platform knew, arranged neatly, and genuinely unreadable. You cannot skim eleven charts, so people read none of them. Ordering the page by the questions a researcher actually asks, and letting the first screen answer only the first two, made the same data usable.
Market maker monitoring needed its own correction. My first version presented it as raw activity, which is accurate and requires the reader to interpret everything themselves. Summarising the pattern first and keeping the detail underneath let people scan and then dig, which is how this information gets used.
The rest was iteration on charts with the team: where scales mislead, where a shared axis matters, and how much can be shown before density becomes noise.
04What Changed
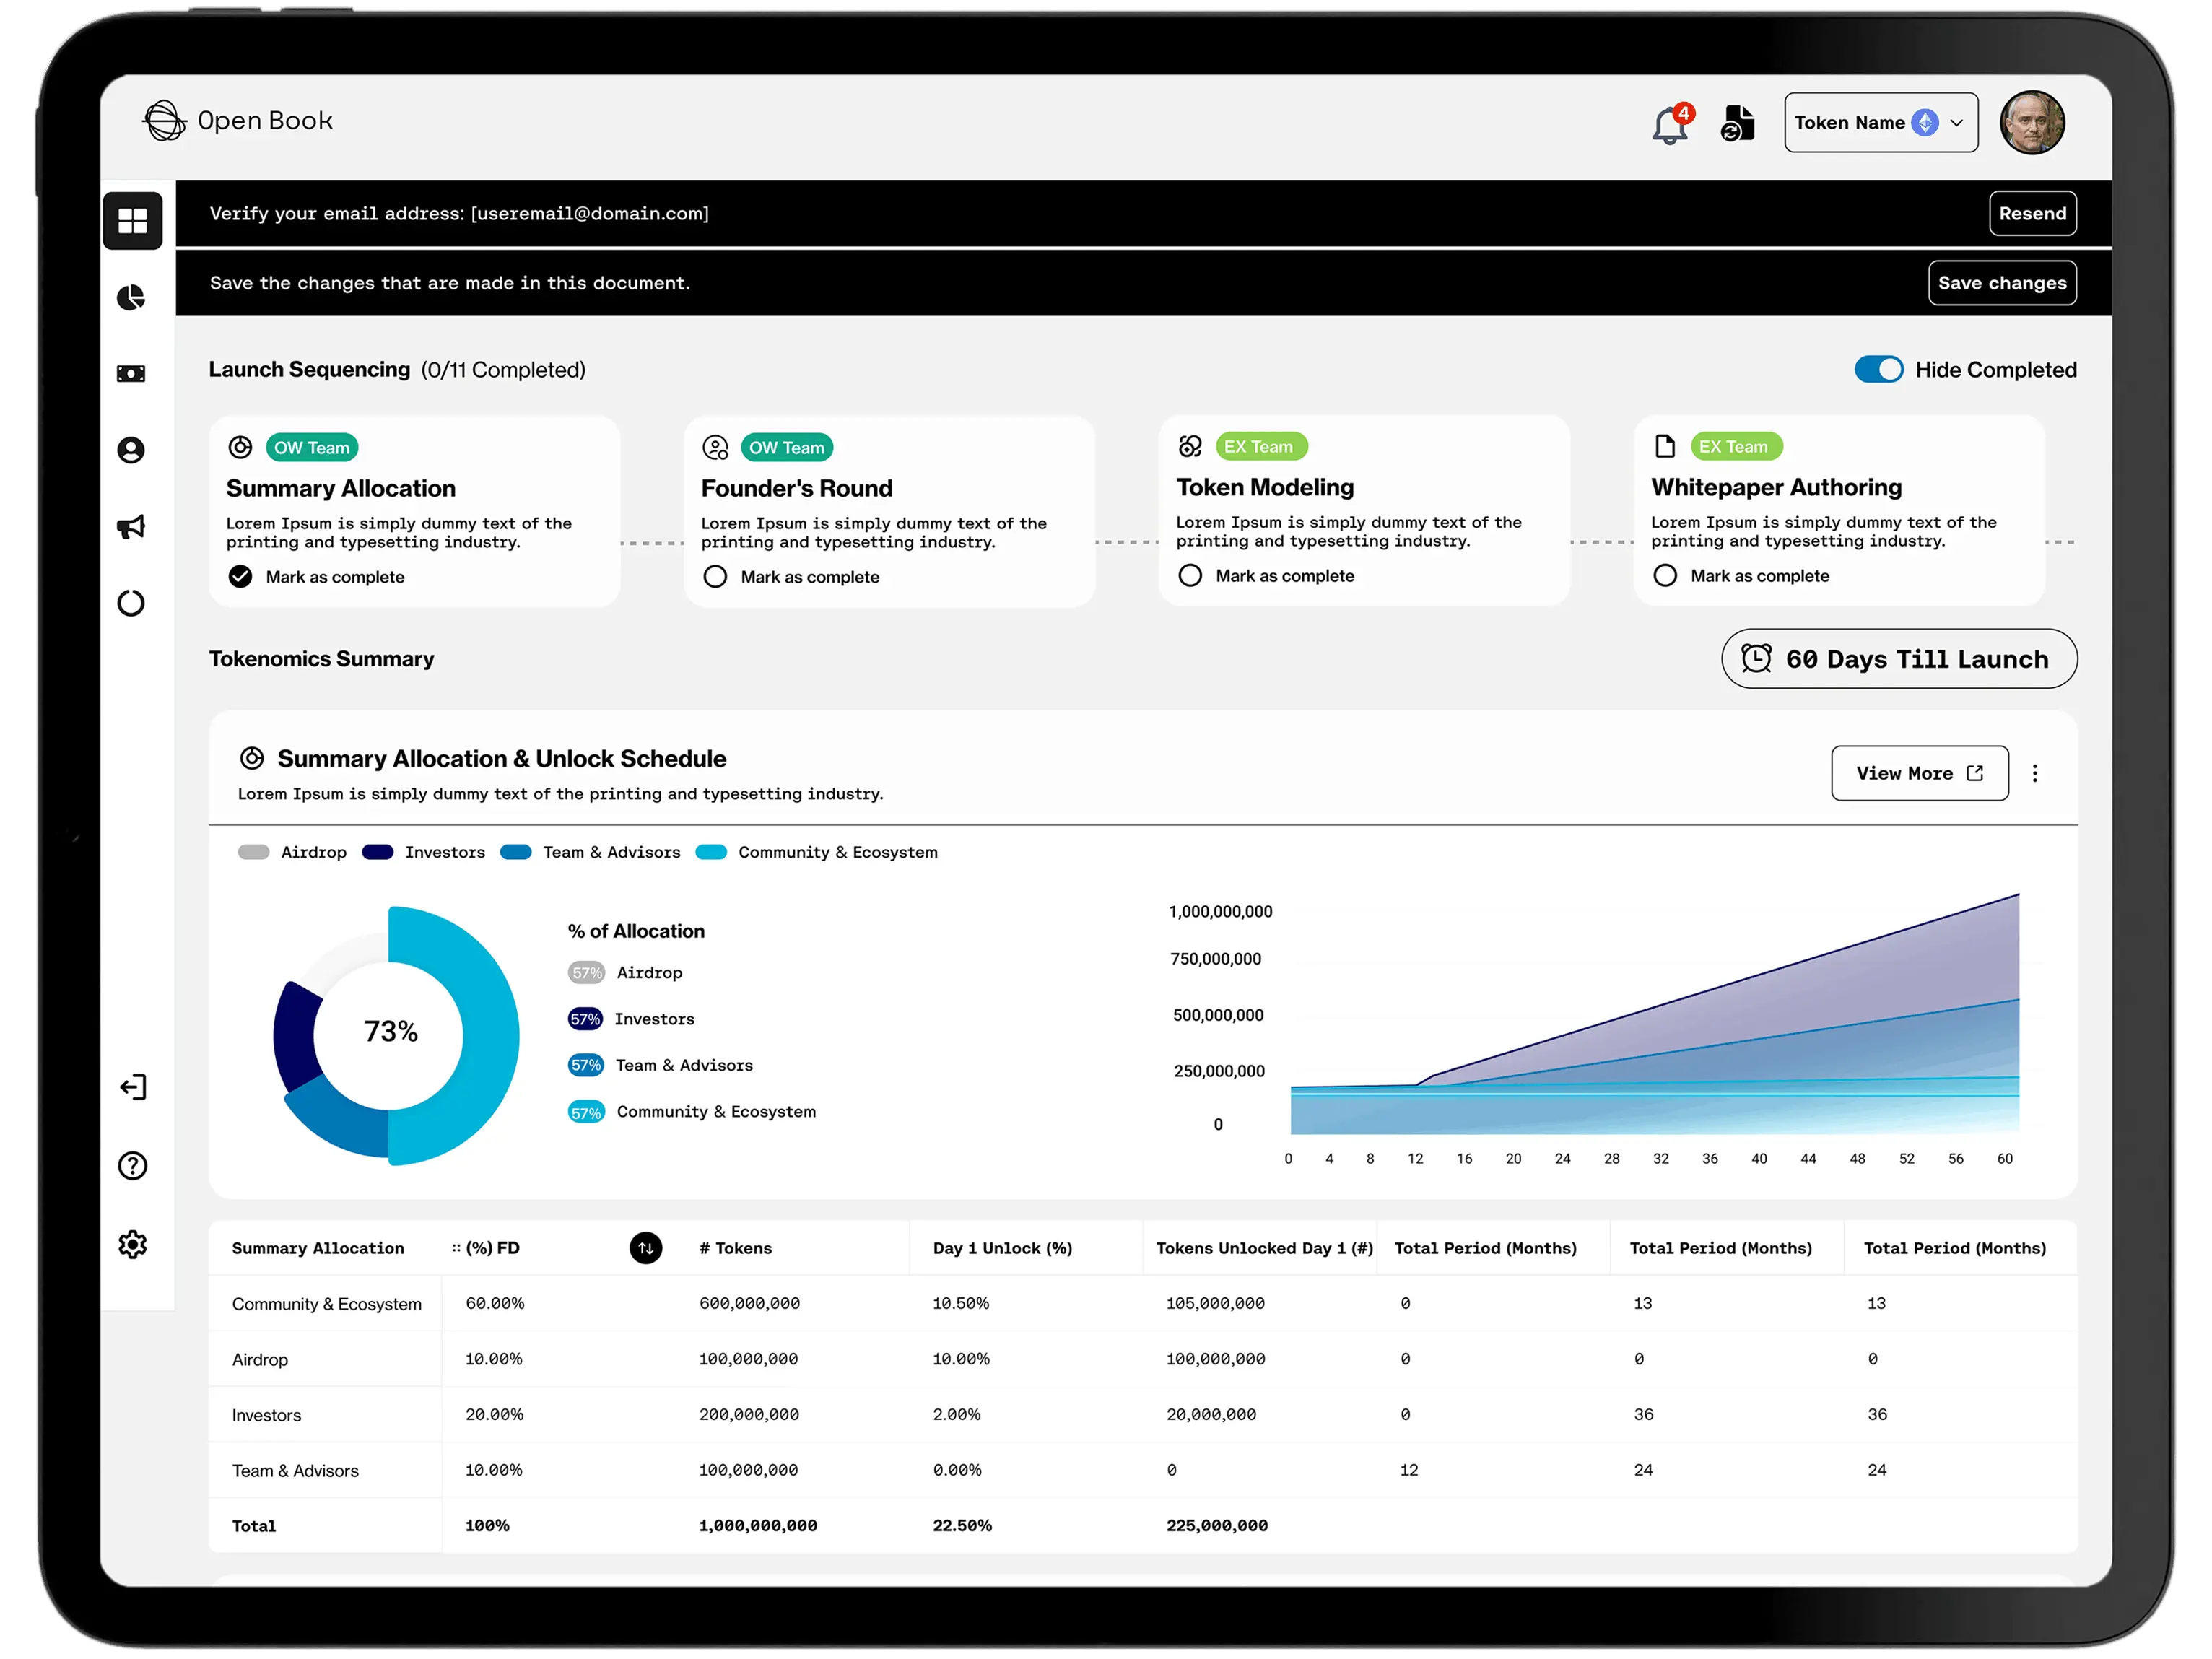
Open Book launched on web and mobile with real-time tokenomics monitoring.
What the design had to deliver
- 01What unlocks next, answered on the first screen.
- 02Every figure carrying its source and its freshness.
- 03One chart language across the whole platform.
Leading with the unlock timeline is the piece I am most pleased with, because it turned a reference tool into something that answers a question.
05What I Had to Work With
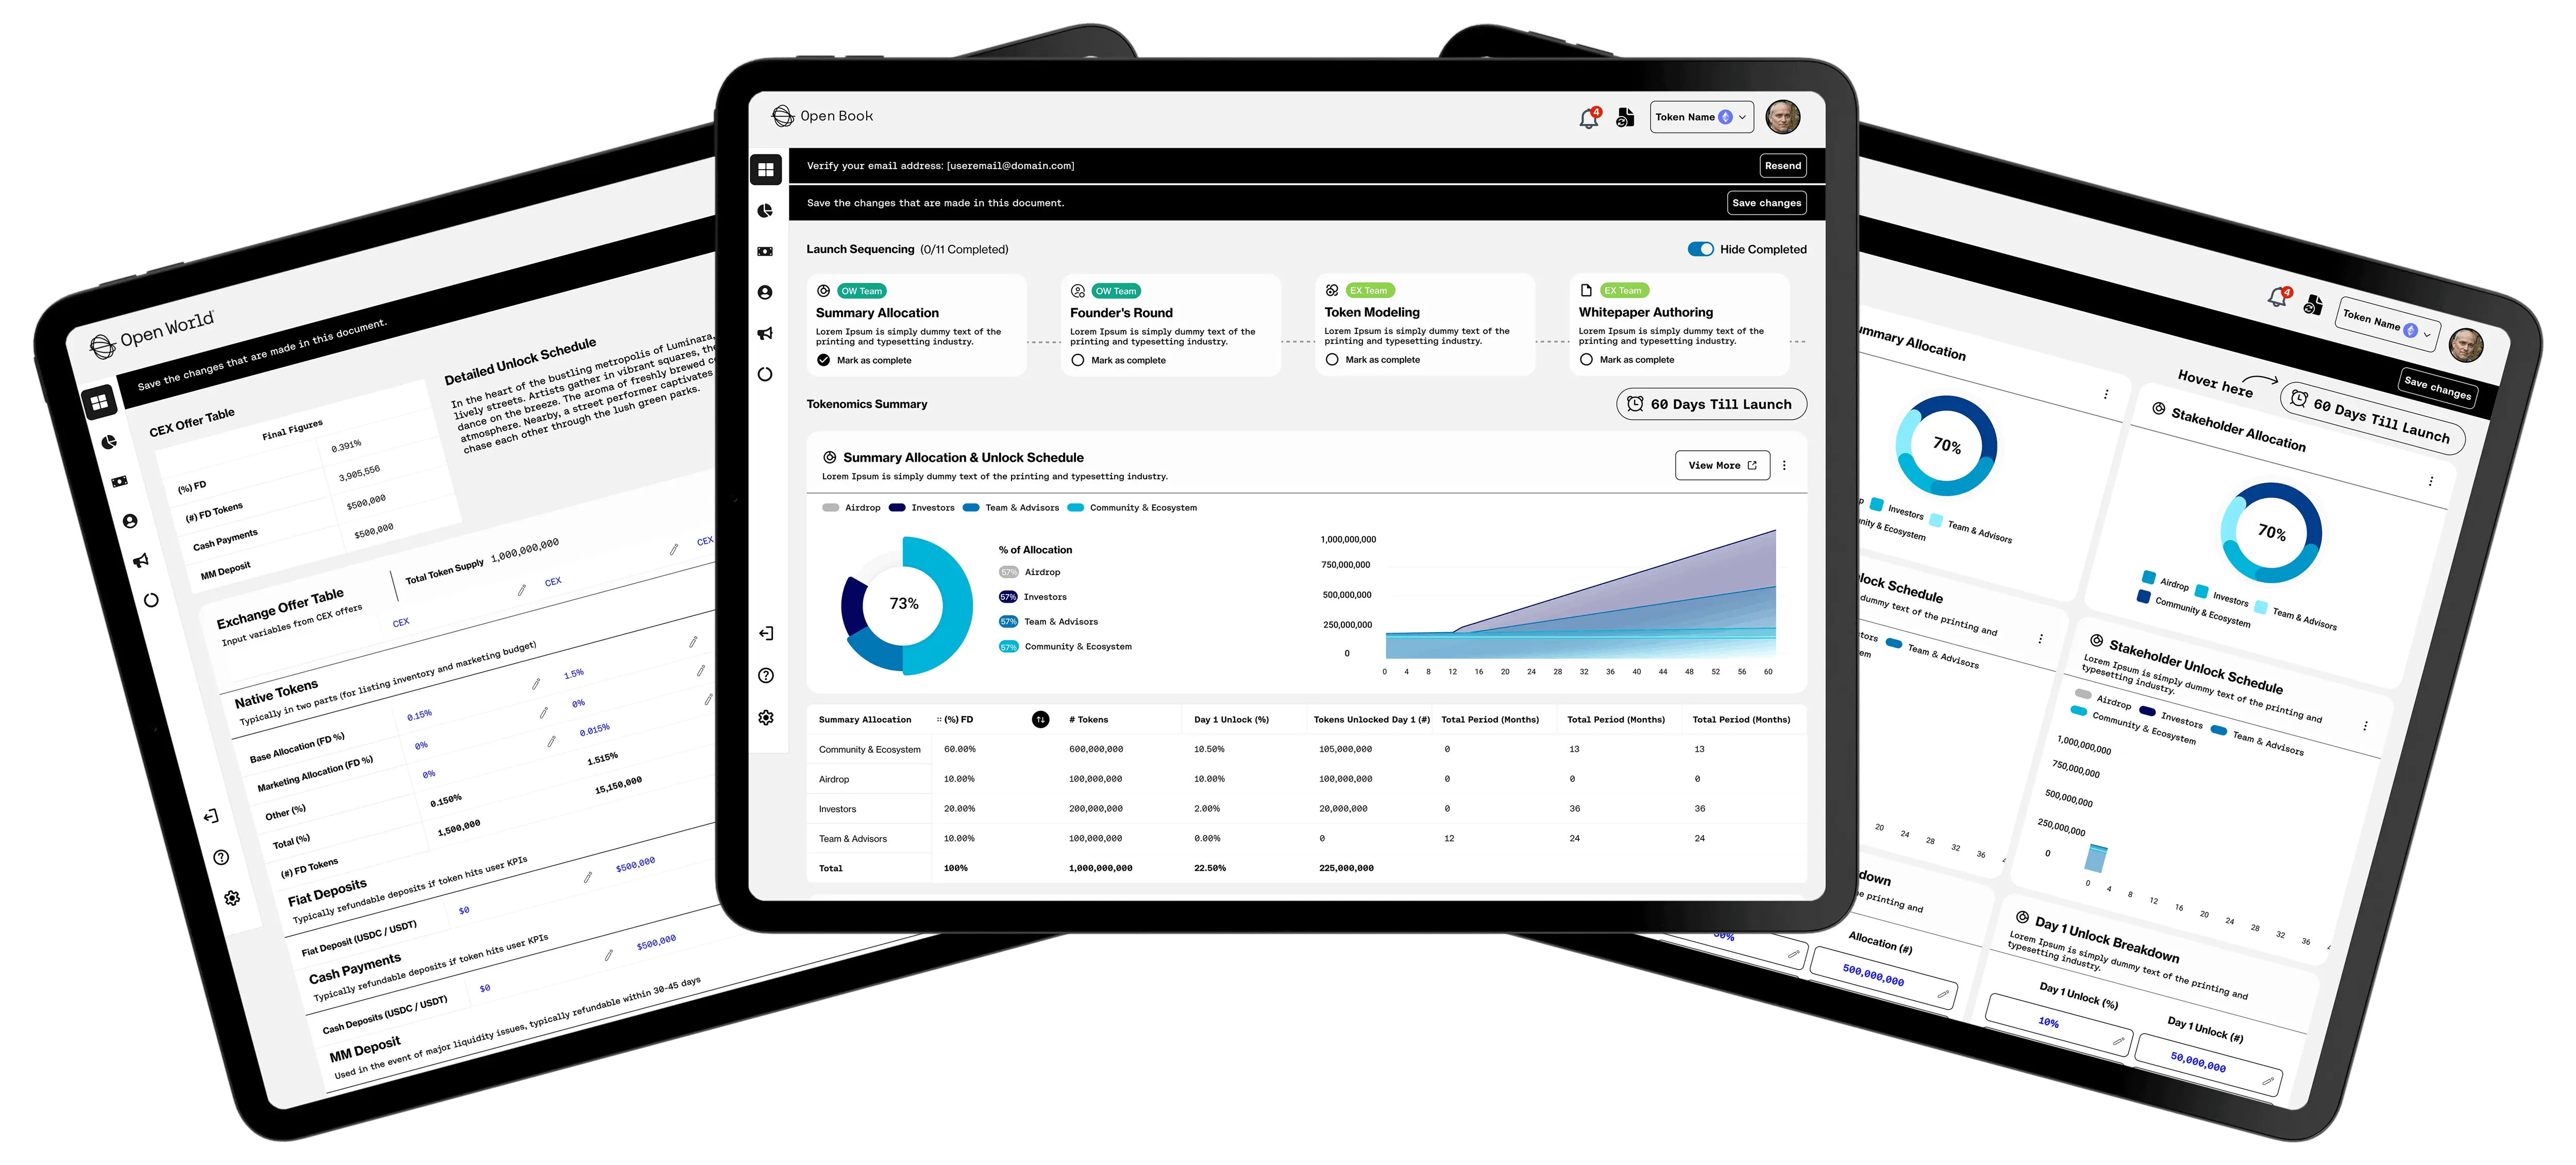
That last one is why the chart system carries so much of the design: it is the part that has to survive the product changing.
- 01Data of uneven quality. Sources vary in completeness and timeliness, and the interface had to be honest about that without undermining itself.
- 02An expert audience. These users want density and will not accept a simplified view, so clarity had to come from ordering rather than from removing.
- 03A fast-moving subject. Whatever the platform tracks today, it will track something else next year, so the layouts had to accept new data types without redesign.
06What I'd Do Differently
I would sit with researchers while they do this work manually before designing anything. I inferred the order of their questions and got it roughly right, but watching would have got it exactly right and saved a redesign.
I would also design the mobile experience first. On a platform this dense, deciding what survives a small screen is the fastest way to find out what actually matters.
What I Learned
- 01Order is the design. Nothing was removed from the token page. Sequencing it by the reader's questions was the entire fix.
- 02Summarise, then show the detail. Raw activity respects the expert and helps nobody; a pattern with the detail underneath serves both.
- 03Admitting uncertainty builds trust. Showing source and freshness made the platform more credible than presenting every number as fact.